Cycle indicators that traders can use to predict stock movement
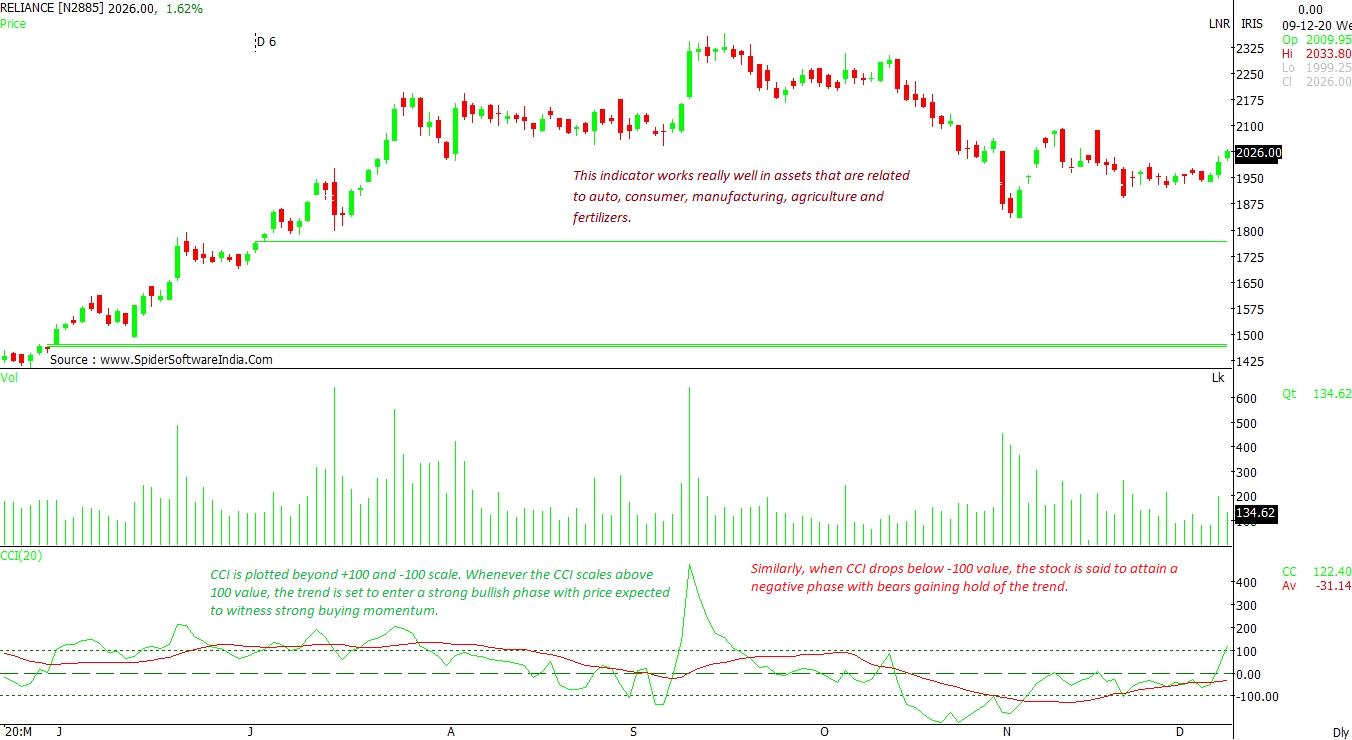
The two major cyclical indicators that assists in identifying the shift in cyclical trend are: Commodity Channel Index (CCI) and Detrended Price Oscillator (DPO)
 "Cycle indicators that traders can use to predict stock movement")
premium
WebinarsNew
Deep DiveNew
Explore Business Standard
The two major cyclical indicators that assists in identifying the shift in cyclical trend are: Commodity Channel Index (CCI) and Detrended Price Oscillator (DPO)
Already subscribed? Log in
Subscribe to read the full story →
3 Months
₹300/Month
1 Year
₹225/Month
2 Years
₹162/Month
Renews automatically, cancel anytime

Over 30 premium stories daily, handpicked by our editors


News, Games, Cooking, Audio, Wirecutter & The Athletic
Digital replica of our daily newspaper — with options to read, save, and share


Insights on markets, finance, politics, tech, and more delivered to your inbox
In-depth market analysis & insights with access to The Smart Investor


Repository of articles and publications dating back to 1997
Uninterrupted reading experience with no advertisements


Access Business Standard across devices — mobile, tablet, or PC, via web or app
First Published: Dec 31 2020 | 8:38 AM IST