Markets have remained volatile over the past few sessions, mainly owing to stock-specific actions with respect to quarterly numbers, Budget proposals and coronavirus outbreak on the global front.
Here's a look at how frontline indices S&P BSE Sensex and Nifty, and other major indices look on the technical charts -
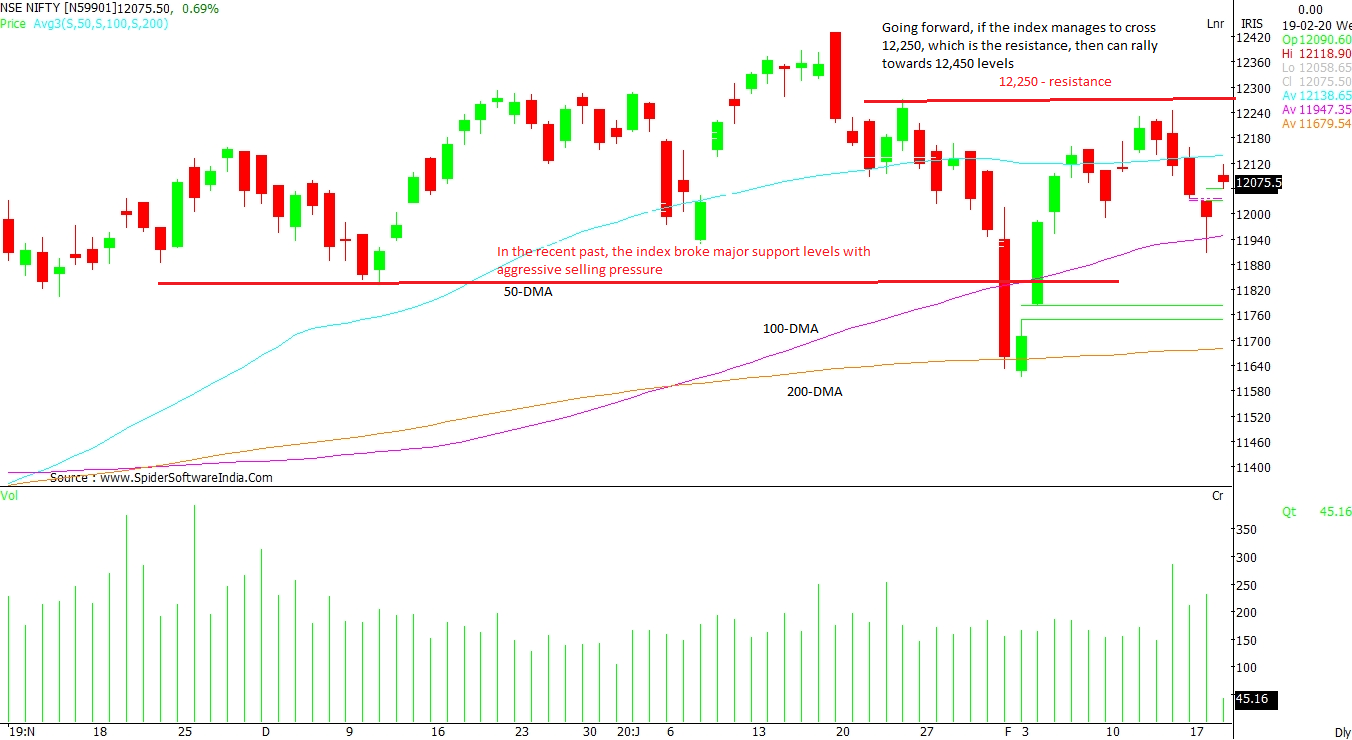
NIFTY 50: In the recent past, the index has broken major support levels with aggressive selling pressure. However, it could manage to hold the losing momentum around 200-day moving average (DMA) placed at 11,655 levels on the closing basis. The reversal having gap up close, was seen with added volumes regaining the positive strength. Currently, after a decent close above 50-DMA placed at 12,125 levels, the index is retesting the support of 100-DMA placed at 11,947 levels. Going forward, if the index manages to cross 12,250 - its resistance level, then it can rally towards 12,450 levels.
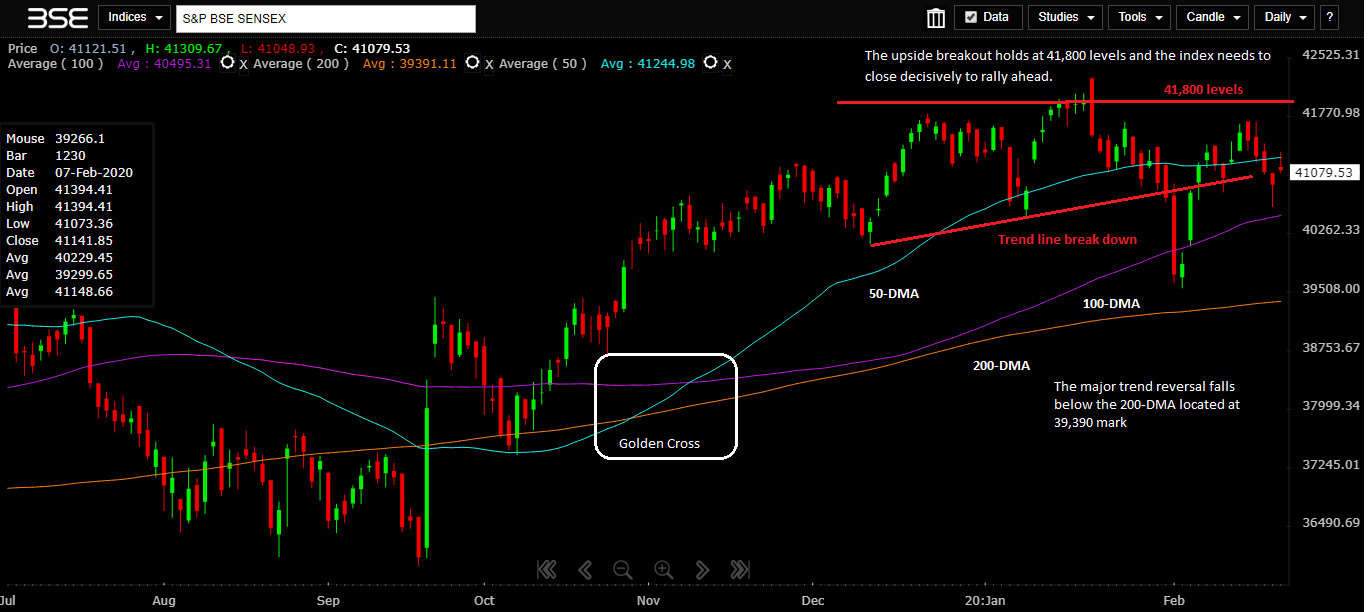
CLICK HERE FOR THE CHART S&P BSE SENSEX: The major trend reversal falls below the 200-DMA located at 39,390-mark. The daily chart does show a trend line breakdown, however follow-up selling has not appeared. As the index trades well above the 100-DMA placed at 40,495 levels, and the trend indicates a move towards 50-DMA, the overall sentiment remains positive. The upside breakout holds at 41,800 levels and the index needs to close decisively to rally ahead.
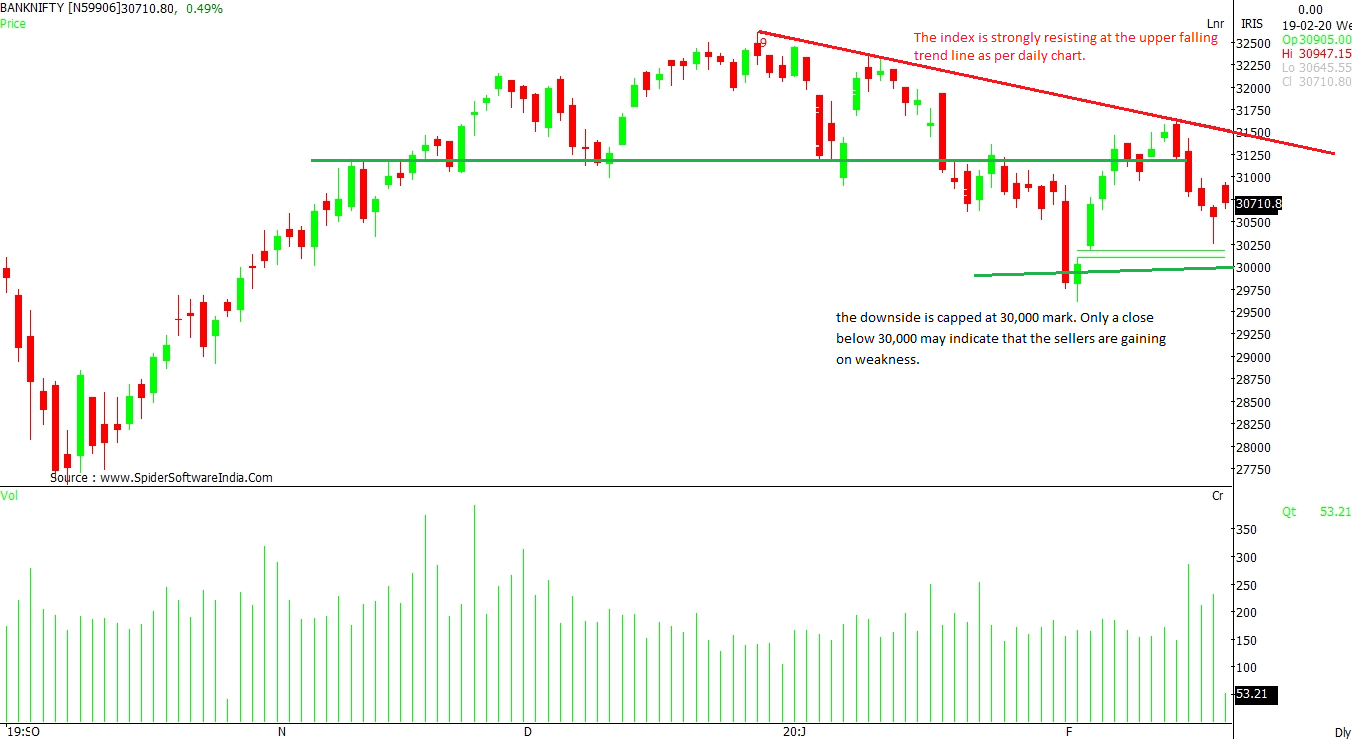
CLICK HERE FOR THE CHART NIFTY BANK: The index is strongly resisting at the upper falling trend line as per the daily chart. Now onwards, a rally above Rs 31,500 with strong volumes may trigger a medium-term positive signal. On the other hand, the downside is capped at 30,000 mark. Only a close below 30,000 may indicate that the sellers are gaining on weakness.
CLICK HERE FOR THE CHART Nifty AUTO INDEX: If the index stays below 7,800 levels for a few more sessions, then this may turn into a bearish phase. The bigger picture shows a “Double Top” formation signaling weakness and negative sentiment. For this index to gain momentum, the 8.000-mark becomes the major hurdle. The overall trend shows the index is heading towards 7,500 levels.
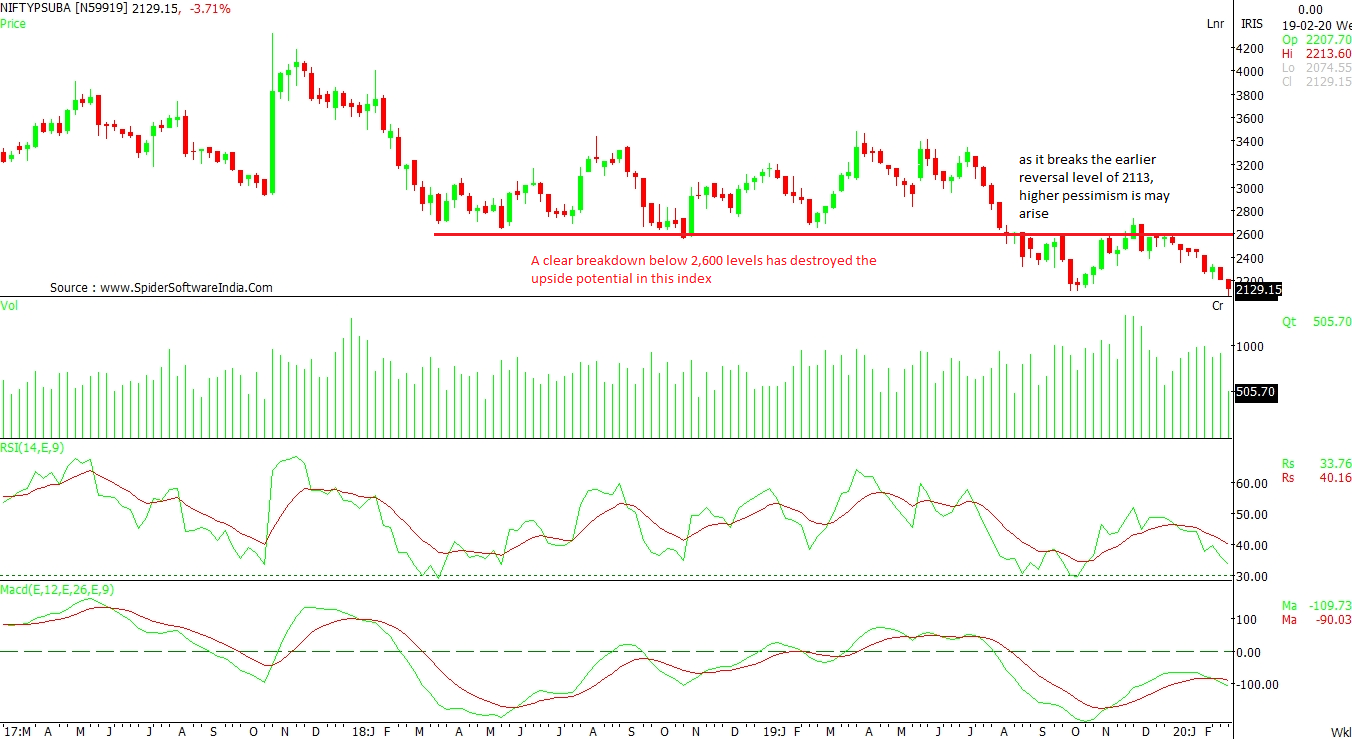
CLICK HERE FOR THE CHART NIFTY PSU BANK: A clear breakdown below 2,600 levels has destroyed the upside potential in this index as per the weekly chart. Now, as it breaks the earlier reversal level of 2,113, higher pessimism may emerge. Both the key technical indicators, Relative Strength Index (RSI) and Moving Average Convergence Divergence (MACD) have made a negative crossover suggesting further downside.
CLICK HERE FOR THE CHART  "Tech View: Sensex, Nifty see volatile sessions, but trend remains positive")


