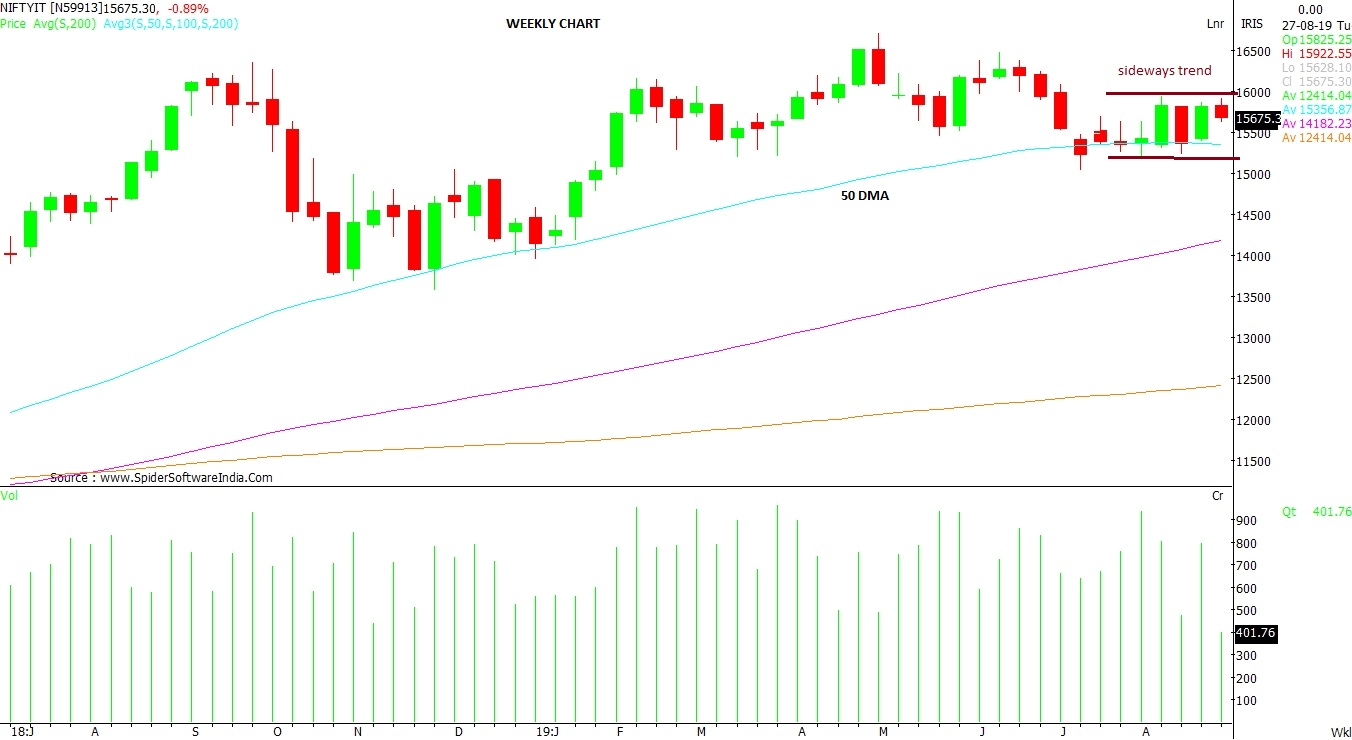
NIFTY IT: The weekly chart shows a strong support of 50-weekly moving average (WMA) from the last two years, currently placed at 15,357 levels. Though the index did break the average in recent trading sessions, it failed to make a convincing breakdown. Going ahead, if the index conquers 16,000 mark with volumes, a rally of another 500 – 700 points cannot be ruled out. A significant strength is shown by Relative Strength Index (RSI). Positive divergence support are also indicating an upside, charts suggest. Similarly, Moving Average Convergence Divergence (MACD) has also crossed the zero line upward, which is a signal of a possible up move in the days ahead.
CLICK HERE FOR DETAILED CHART VIEW
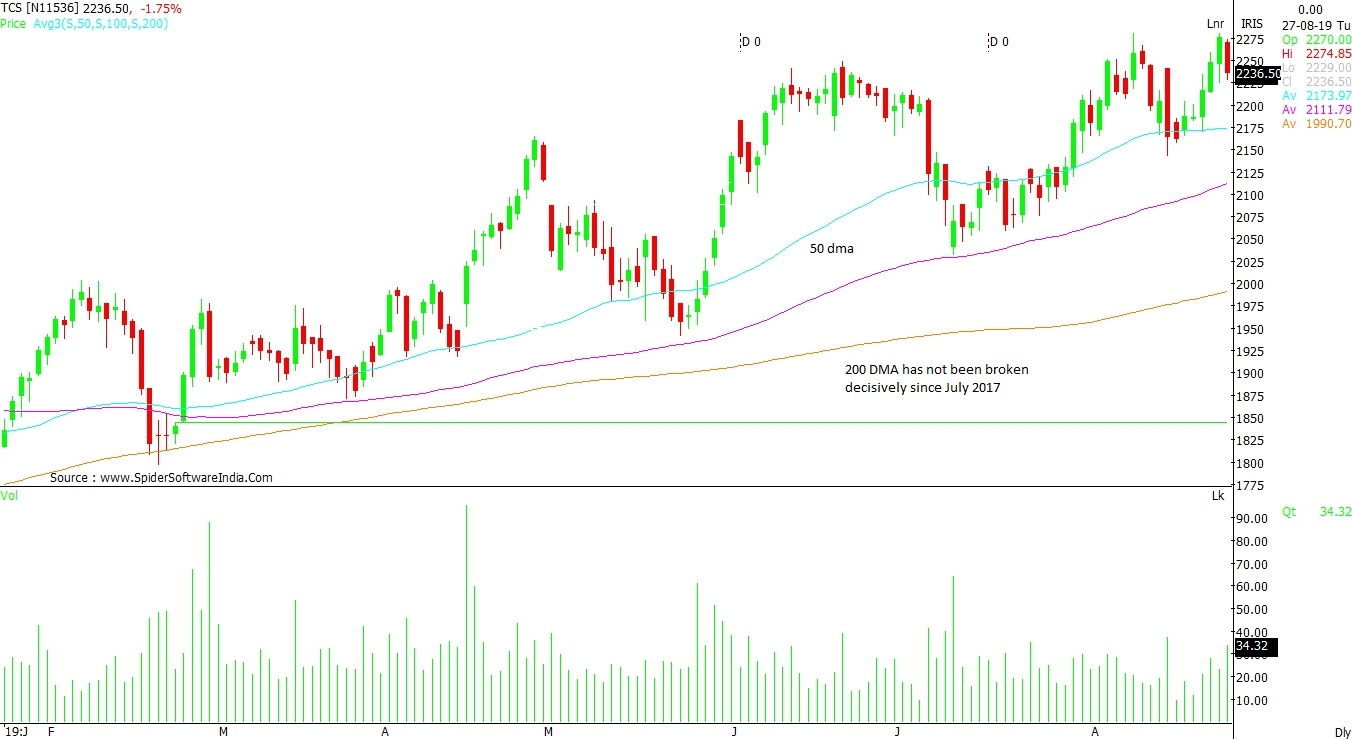
TATA CONSULTANCY SERVICES (TCS): The 'higher highs, higher lows' formation on the charts has consistently boosted the positive sentiment, weekly charts suggest. Going forward, till the counter trades above the lower rising trendline, bullishness is here to stay. Taking a broader perspective, the 200 DMA has not been broken decisively since July 2017. The immediate support comes at Rs 2,173 and Rs 2,111, respective 50 DMA and 100 DMA.
CLICK HERE FOR DETAILED CHART VIEW
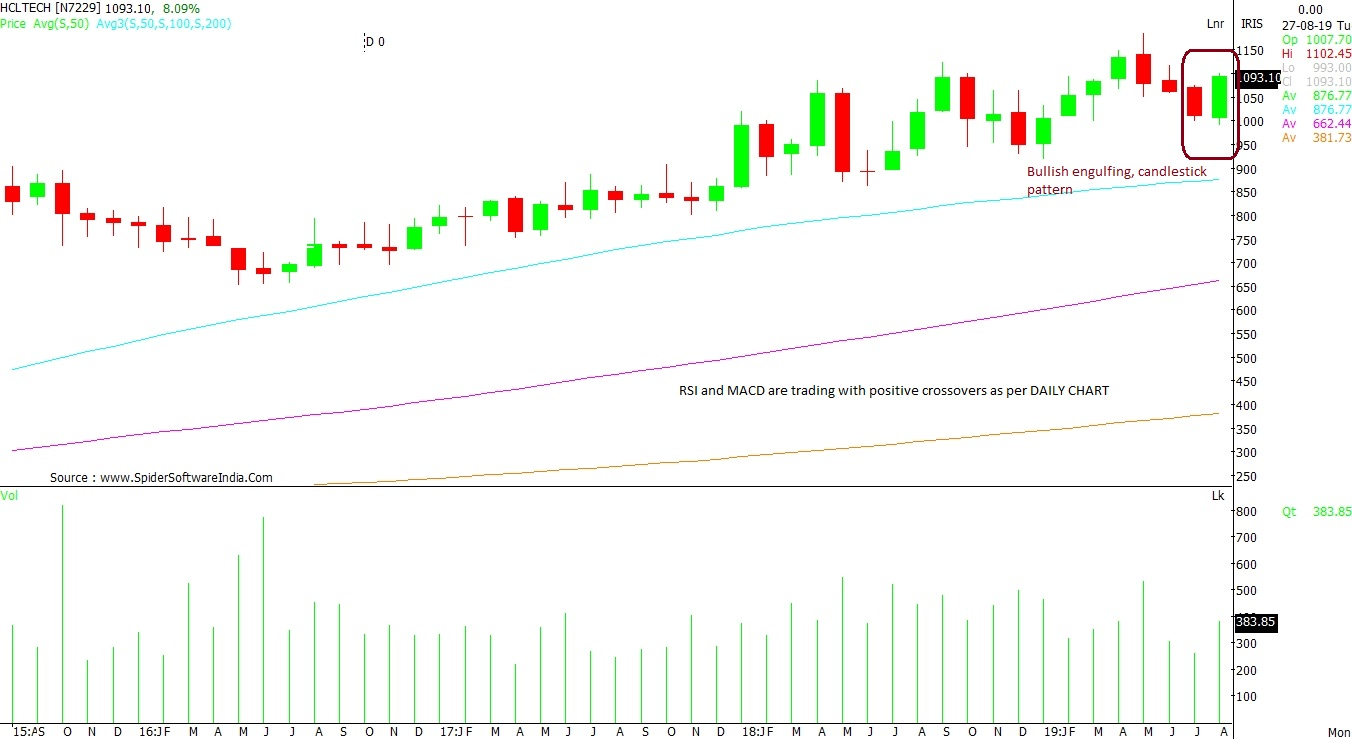
HCL TECHNOLOGIES (HCLTECH): The monthly chart shows “Bullish engulfing” candlestick pattern, suggesting a bigger breakout above Rs 1,130 mark. After a recent consolidation in the range of Rs 1,000 – Rs 1,040, the counter is heading towards conquering the Rs 1,100 mark. The trend remains sluggish, as volumes remain average. The daily and weekly charts shows a possibiity of profit booking at subsequent highs. The RSI and MACD indicators are trading with positive crossovers - a signal of upward trend in the short-term as per the daily chart.
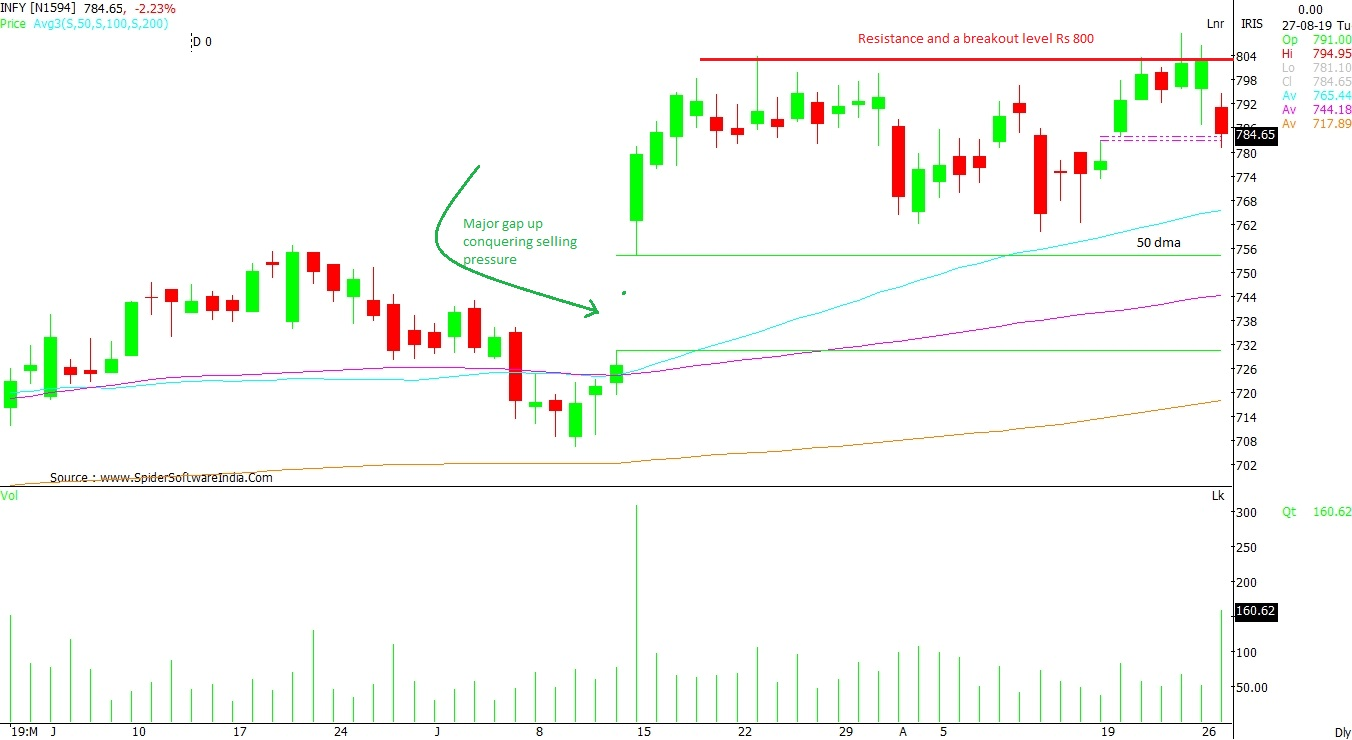
CLICK HERE FOR DETAILED CHART VIEW  "Is Infosys a good bet post Rs 8260-crore buyback? Here's what charts say")


