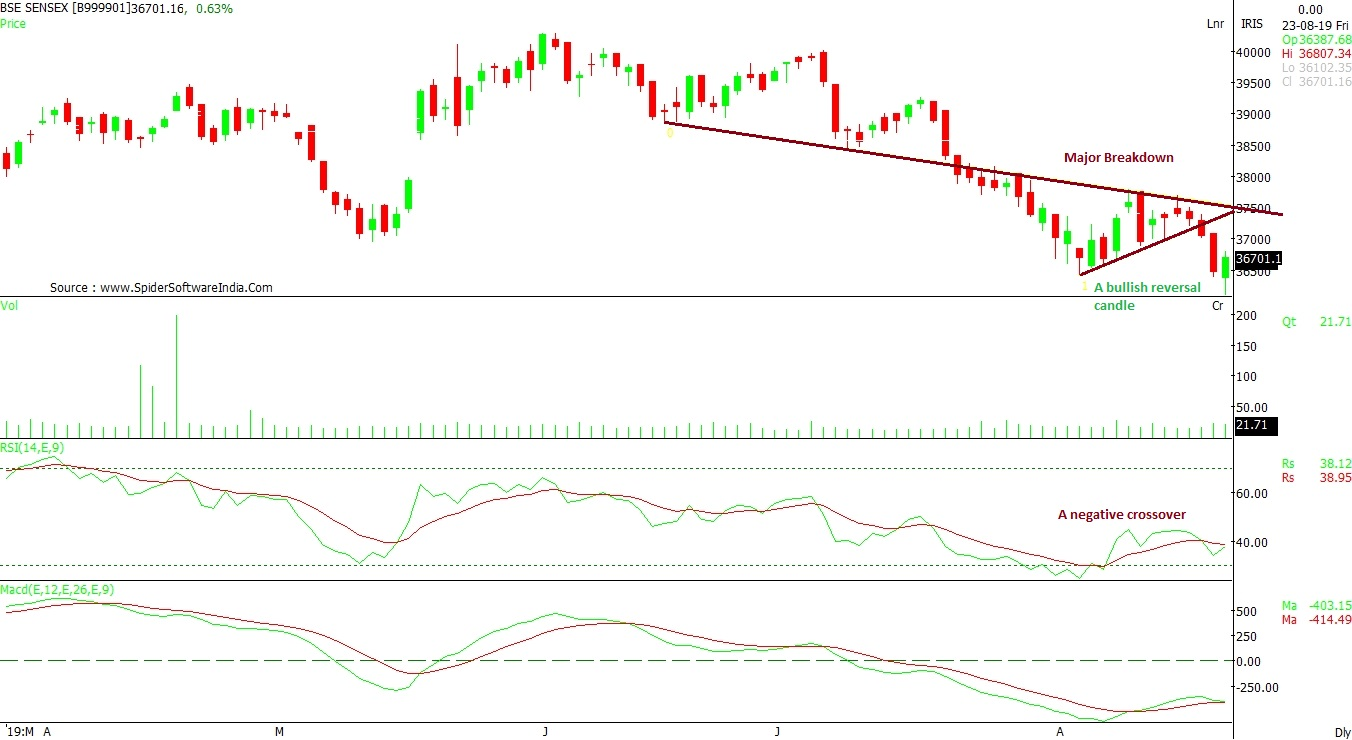
S&P BSE SENSEX: The daily chart reveals 37,500 to be the breakout level for the index, one that can change the negative sentiment and revive the upside rally. The index ws unable to sustain above the 37,000 mark, going ahead, 37,000 – 37,500 levels will act as a resistance range. A bigger upside rally is expected only if it has added volumes and the index is able to hold above the resistance zone. The candlestick pattern on Friday showed a bullish reversal. That said, this reversal needs to have one more positive close. If that happens, then only we can see a positive sentiment prevailing for the current week, which also has F&O expiry on Thursday.
CLICK HERE FOR DETAILED CHART VIEW
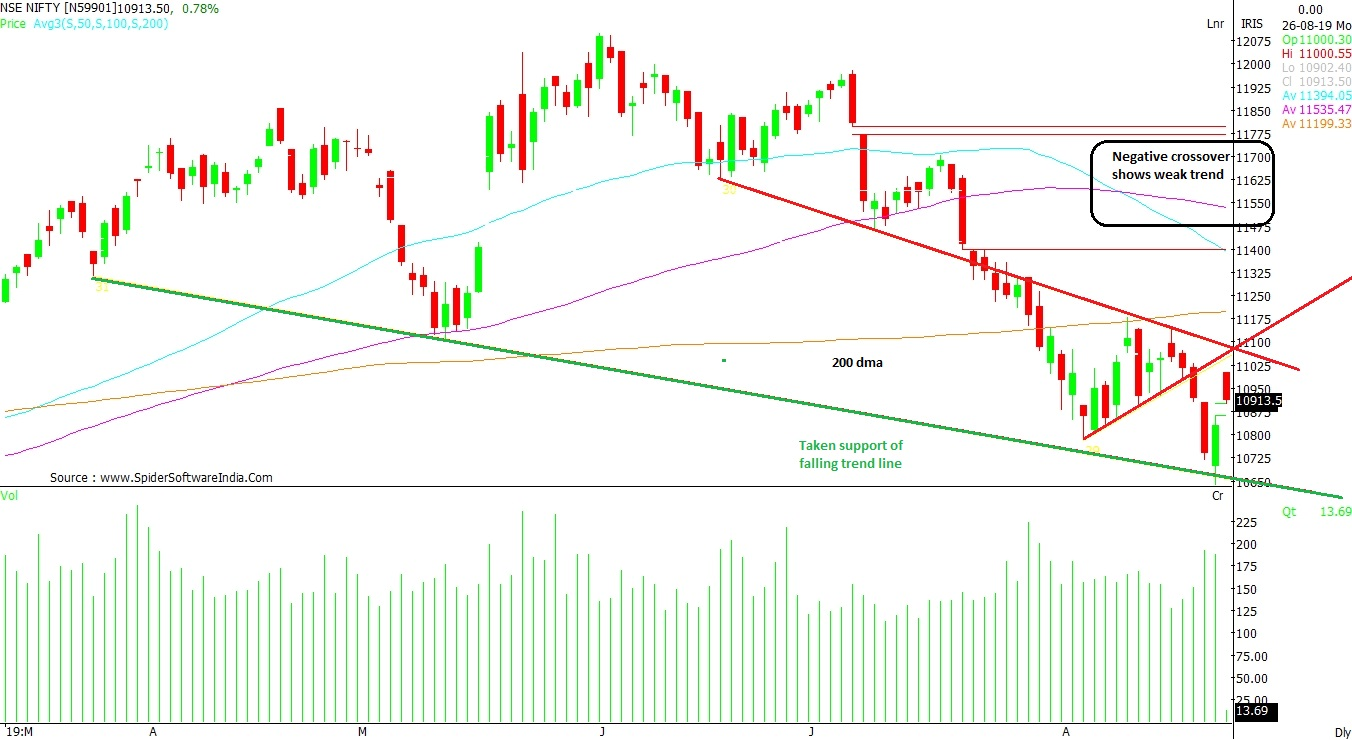
NIFTY 50: The index has taken a major support of a falling trend-line last Friday. 10,680 was the key level and a close below the same could have dented the market sentiment. The index needs to scale and close above the 'upper falling trendline' with a decisive volume, which is placed at 11,100 levels. The daily chart denotes a breakdown below 11,000 that had ruined the positive sentiment earlier. Going forward, 11,100 remains a key indicator for a turnaround.
CLICK HERE FOR DETAILED CHART VIEW
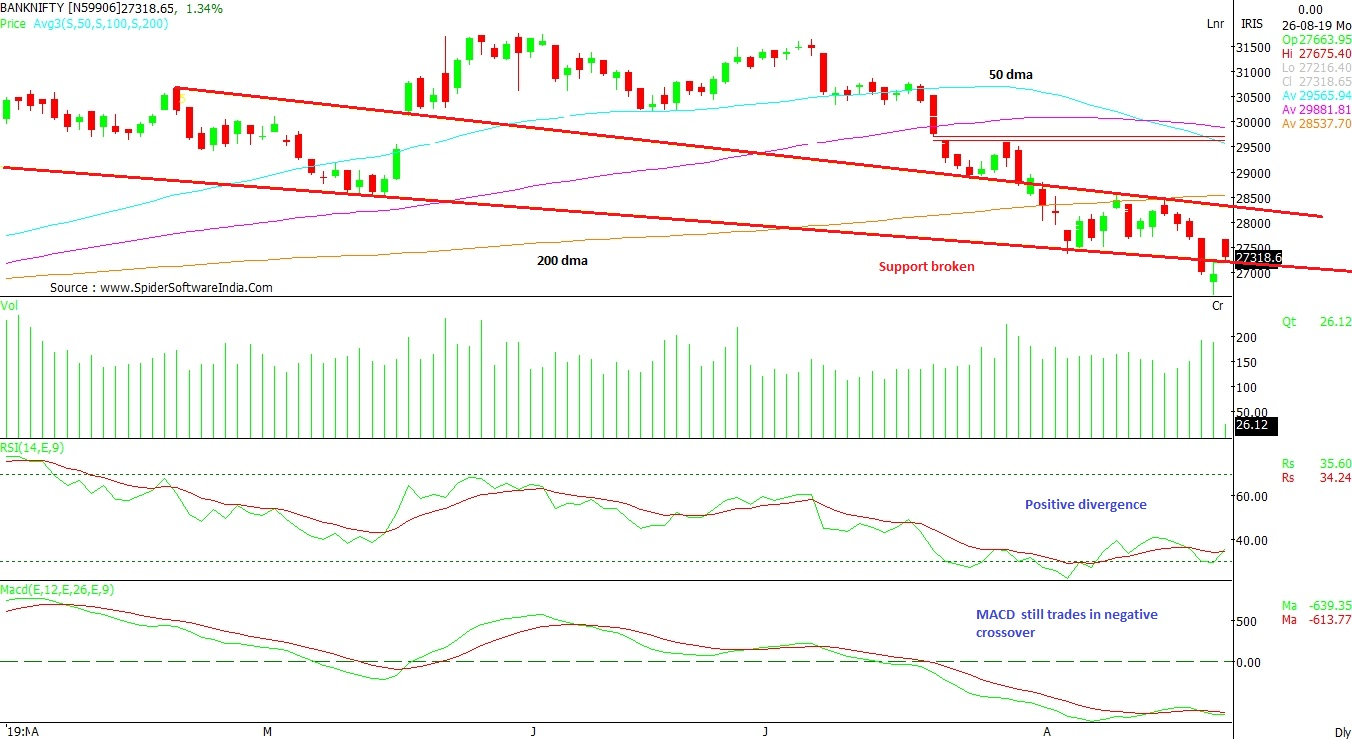
NIFTY BANK: The index has breached the support of falling trendline placed at 27,250 in the last week. However, if the gap-up level manages to conquer 27,700 in the coming days, then a revival in trend cannot be ruled out. On the other hand, a fall below 27,000 disrupted the upside momentum, resulting in a scenario of 'sell on rise' in last week. As the Friday candle exhibited 'Doji pattern', a strong positive close today could see the index moving up for the remaining part of this week. The technical indicators are mixed. While Relative Strength Index (RSI) is showing positive divergence, Moving Average Convergence Divergence (MACD) still trades in a negative crossover below zero line.
CLICK HERE FOR DETAILED CHART VIEW
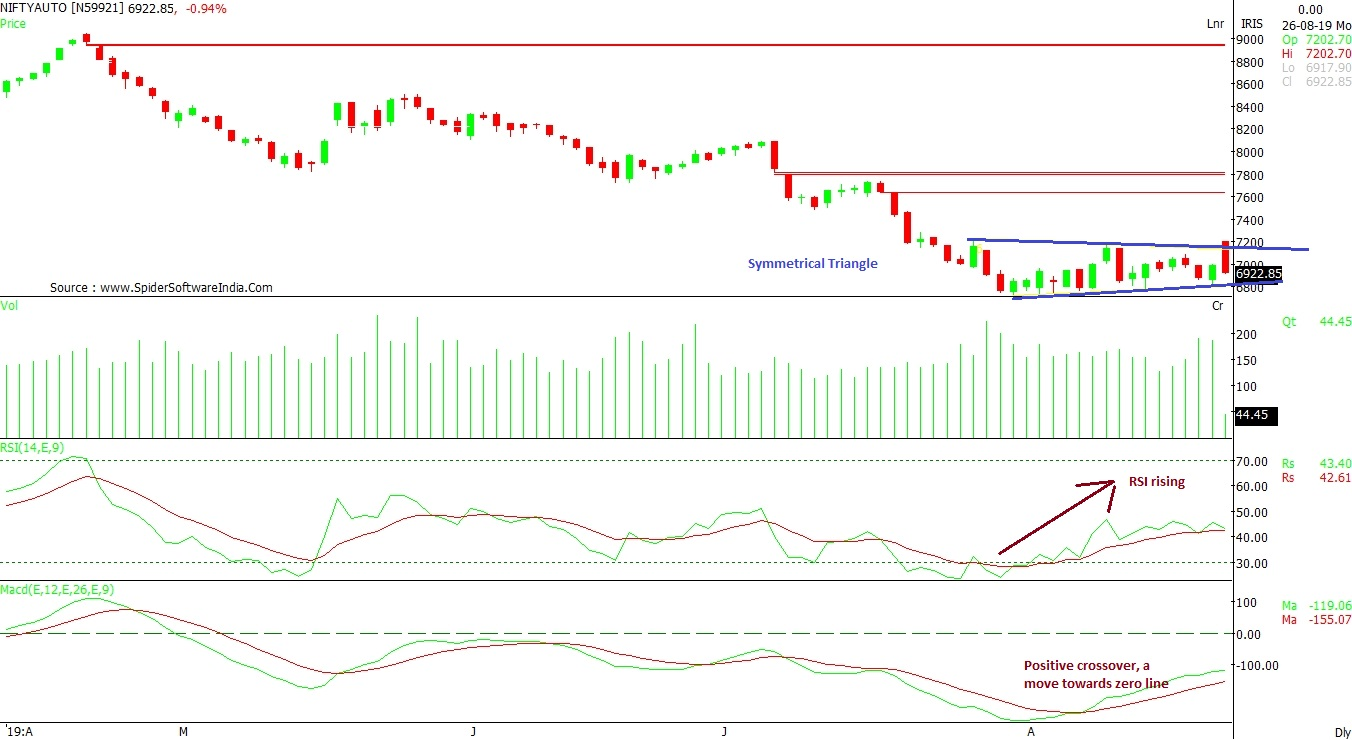
NIFTYAUTO: The formation on the daily charts reveals “Symmetrical Triangle” with 7,100 mark acting as a breakout level. The overall trend has been 'lower highs, lower lows' formation, with every upside witnessing selling pressure. The on-going positive trend, although supported by RSI, needs to hold 6,700 level on the lower side. If broken, may lead then to another leg of selling. One needs to be very cautious about this index. Techncial charts indicate a possible upmove of 400 -500 points. MACD is trading with positive crossover heading towards the zero line. That said, a clear direction can be mapped once the formation unmasks.
CLICK HERE FOR DETAILED CHART VIEW
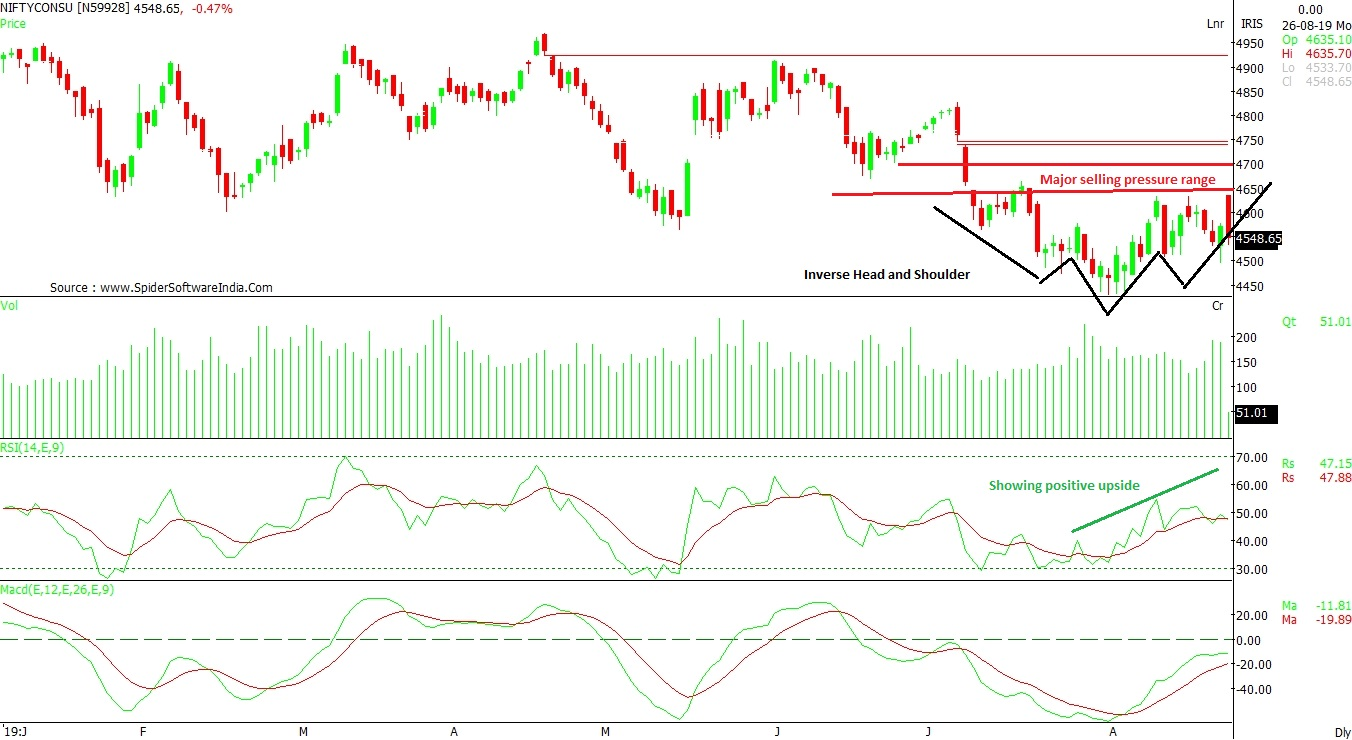
NIFTYCONSUMPTION INDEX: The consumer index, though looks promising on technical indicators (RSI and MACD), unless it absorbs the selling pressure arising in the range 4,650 – 4,750, an upside breakout may not hold good for the medium-to-long term. The volume scenario still lags the strength. On the other hand, 4,450 -4,500 remains a support level. Considering the present scenario where the index is losing sheen, the ideal strategy could be to wait-and-watch.
CLICK HERE FOR DETAILED CHART VIEW
 "Markets may see selling pressure; Sensex faces resistance at 37,000 mark")


