The benchmark indices – the S&P BSE Sensex and the Nifty50 – have lost over 1.5 per cent thus far in calendar year 2022 as global headwinds took center stage. Despite the possibility of sooner-than-expected and a more aggressive rate hike by the US Federal Reserve, geopolitical tension between Russia and Ukraine that fueled the rise in Brent crude oil prices to an eight-year high of around $97 a barrel, analysts still are hopeful that the markets will weather the storm.
While they are cautious and suggest that the markets will remain volatile over the next few weeks till the headwinds abate or there is clarity on how the geopolitical situation is progressing, they suggest investors use the market correction to buy from a medium-to-long term perspective in stocks of fundamentally sound companies that have revenue visibility.
“This uncertainty is only a passing phase and structural growth levers led by huge infra spend, industrial capex recovery, bumper harvest, inclusive growth and huge untapped demand remain intact. Remain positive on India growth story and expect markets to de-couple over next 3-6 months and positive returns incrementally by end of 2022,” said Amnish Aggarwal, Head of Research at Prabhudas Lilladher.
While the headline index is down by around 6 per cent from its recent peak, it is masking the weakness in the broader market. There have been much sharper cuts. The correction has been more severe in the expensive/high PE names (including a number of new tech companies), and where the earnings have disappointed, analysts said.
“Elevated volatility can continue for a couple of months more, until we get some more clarity on the inflation trajectory and the US Fed action. That said, these interim corrections can present a good opportunity to gradually build-up on the equity exposure, as we continue to believe that the earnings momentum will remain a key support for the market. Our preferred sectors include domestic cyclicals such as financials, industrials & infra, building material and auto, while we would also be positively biased on consumption (especially discretionary), Healthcare, IT (on corrections) and select names on bottom-up basis,” said Milind Muchhala, executive director, Julius Baer, India.
Technical charts, too, suggest the bulls are not ready to give up just yet. Over the past five weeks, the Nifty has retraced 80 per cent of the preceding four weeks rally (16,410-18,350). The slower pace of retracement, according to technical analysts at ICICI Securities, signifies that the broader bullish structure is still intact.
“Any extended breather from hereon should not be construed as negative, instead dips should be capitalised to accumulate quality large-caps, as we do not expect the Nifty to breach key support of 16,800. Our preferred sectors are BFSI, capital goods, metals and Auto,” they wrote in a recent note.
Here are five key technical parameters that suggest why you should not worry much.
200-DMA acting as a support
While both the benchmark indices have remained choppy, they did not violate the 200-day moving average (DMA). For the S&P BSE Sensex, the 200-DMA is placed at 56,460 levels, while Nifty's 200-DMA is at 16,860. Both the indices are trading well above these.
CLICK HERE FOR THE CHART
Relative Strength Index (RSI)
A closer look at RSI reveals a positive divergence on the daily chart. Typically, a positive divergence exhibits a bullish view.
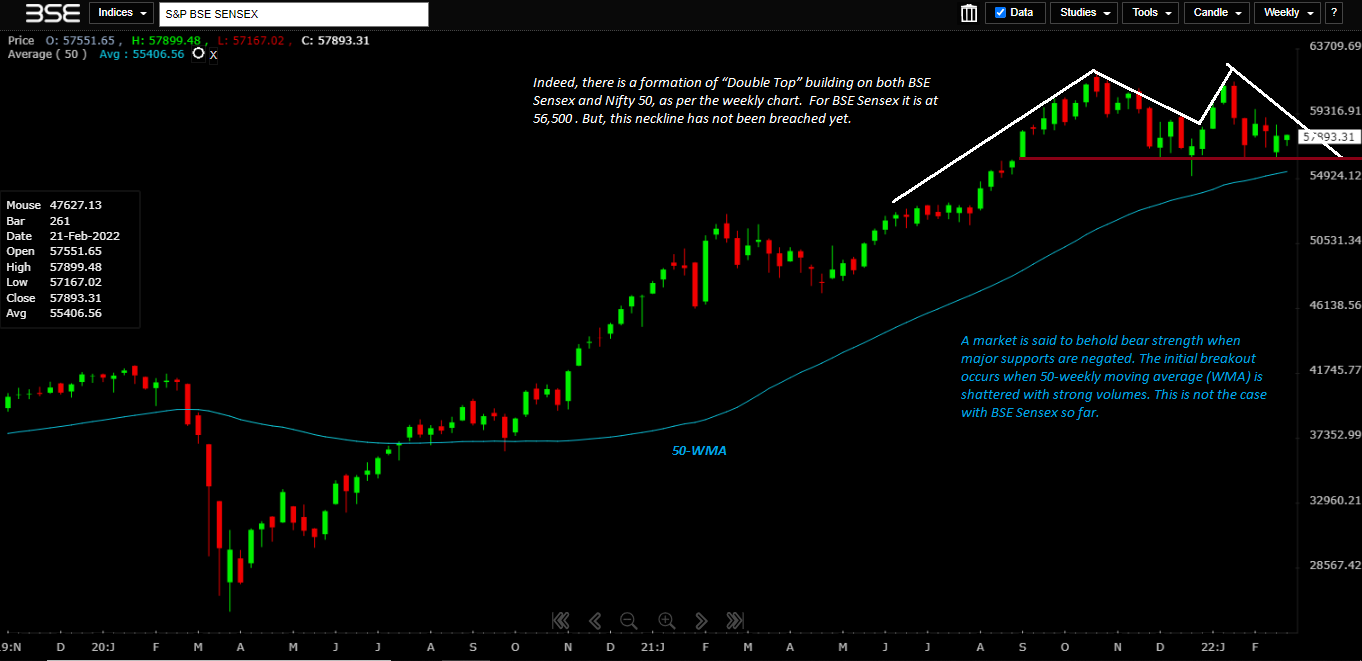
Double Top- chart pattern
There is a “Double Top” formation building on both BSE Sensex (at 56,500) and the Nifty 50 (at 16,800), as per the weekly chart. However, the neckline has not been breached yet, which indicates that there is inherent strength for both these indices not to fall much from here on.
CLICK HERE FOR THE CHART
Bollinger Band squeeze
The Bollinger band is an indicator of volatility. When the bands are far, stocks/indices seem to take one-side directions - either upward or downward. But, when Bollinger Band squeeze occurs, which is currently happening in the Sensex and Nifty 50, the trend remains undecided. The key upper and lower levels to watch here are 59,667 and 56,790 (Sensex); and 17,750 and 16,920 (Nifty).
Support – Resistance
A breach of the 50-week moving average on the downside with strong volume is the first sign that the indices/stocks headed lower. The 50-WMA is placed at 54,500 (Sensex) and 16,500 (Nifty). Both the indices are currently comfortably trading above these levels.
 "Despite headwinds, bulls are not ready to lose control; 5 reasons why")


