Triple top is a trend reversal pattern that depicts buying weakness and a failure to absorb selling pressure, resulting in a sell-off. This chart pattern depicts three distinct peaks, called resistance, inside a price zone that the stock price has failed to conquer. As the price gradually starts showing weakness, and eventually breaks the lower reversal levels, called the support, the asset is said to have a triple top breakdown.
One of the important aspects is to acknowledge the weakness. If the three peaks show weakness at higher levels, the price needs to carry forward the weakness near the breaking point called 'the neckline'.
The triple top pattern is most reliable in an uptrend. Although the breakdown needs to be cautiously watched, the formation has a significant impact on the price.
What does the Triple Top tell you?
-- A confirmed breakdown reflects upcoming selling pressure when significant levels are expected to get broken. Even investors look for early exits.
-- A build-up of short positions may provide opportunity for short-term gains. It reflects bears getting upper hands on the downside and the build-up of negative sentiment.
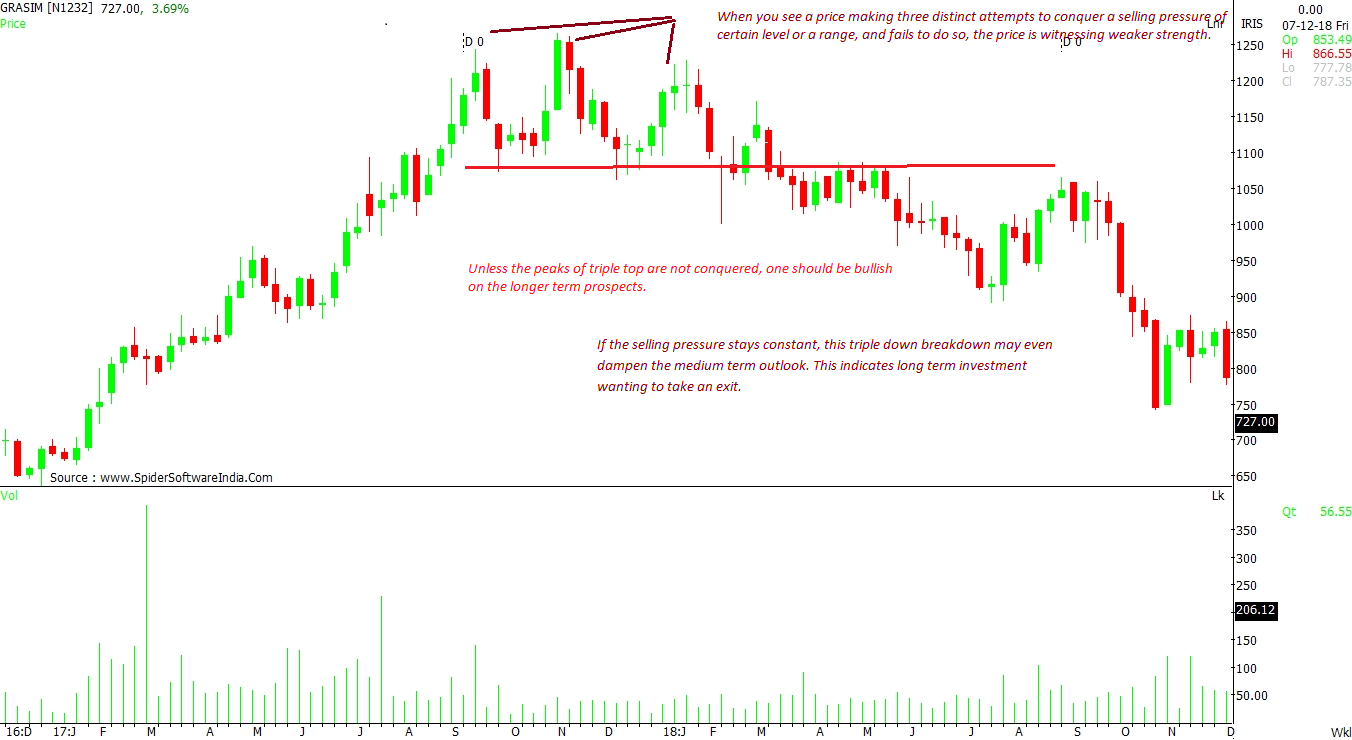
-- If the selling pressure persists, the triple down breakdown may dampen even the medium-term outlook. This indicates long term investment wanting to exit.
-- Triple top formation is seen during a strong upside rally, one that later shows price peaks
If the price makes three distinct attempts to conquer the selling pressure at a certain level or a range, and fails to do so, the price is witnessing diminishing strength. The pattern thus formed is called 'Triple Top'. These three distinct peaks indicate resistance which becomes the stop loss for a downtrend rally.
CLICK HERE TO VIEW THE CHART One can keep the stop loss level slightly above the resistance point. As we go further and the price breaks down on the immediate support, the target is identified as the difference of resistance line and the support line. If the price fails to rebound around the difference value, then the next downside may see a severe sell-off.
Sometimes the price makes wild swings during intra-day sessions, showing a breakout; however, one should wait for a decisive close.
This chart pattern is rare on the daily chart where, usually, the price displays a Double top formation which is similar to triple top, but herein the price resists two peaks. Nonetheless, the breakout or breakdown is more reliable in a triple top than double top.
 "How to identify and trade the Triple Top reversal pattern?")


