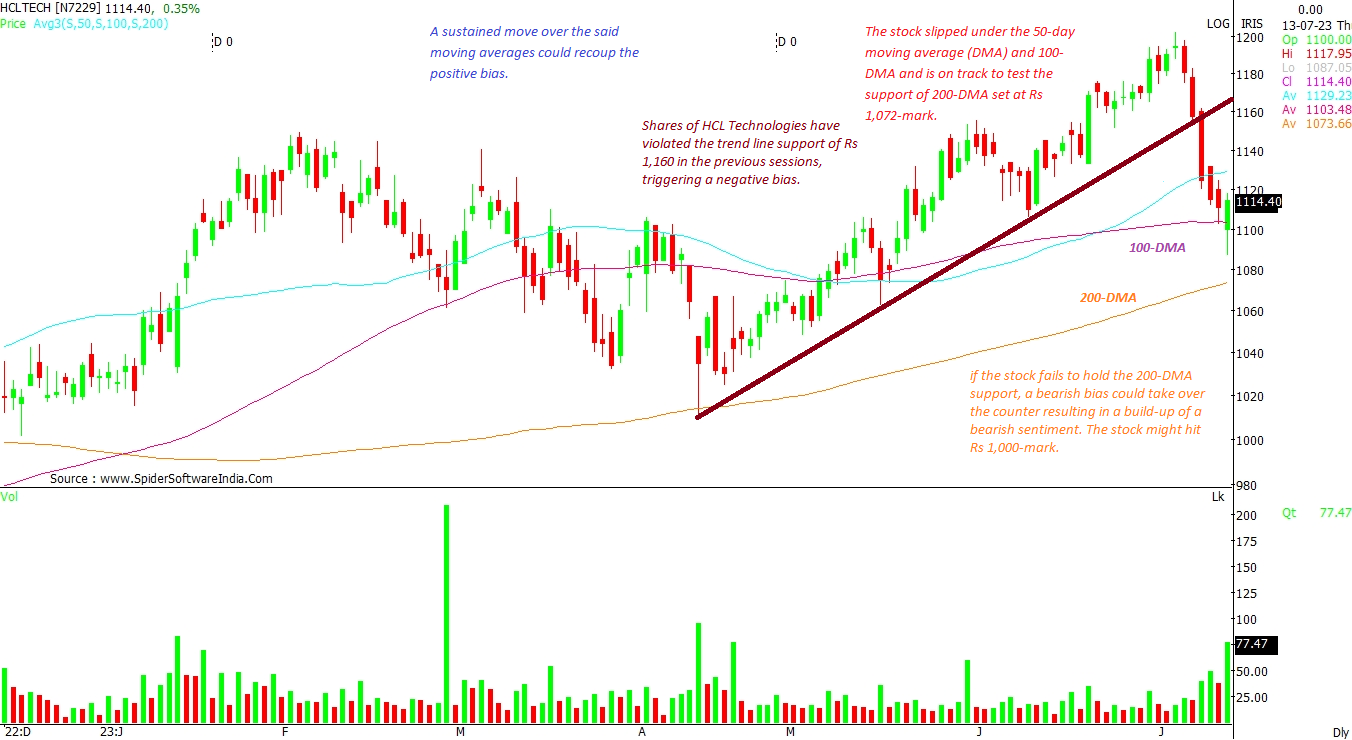
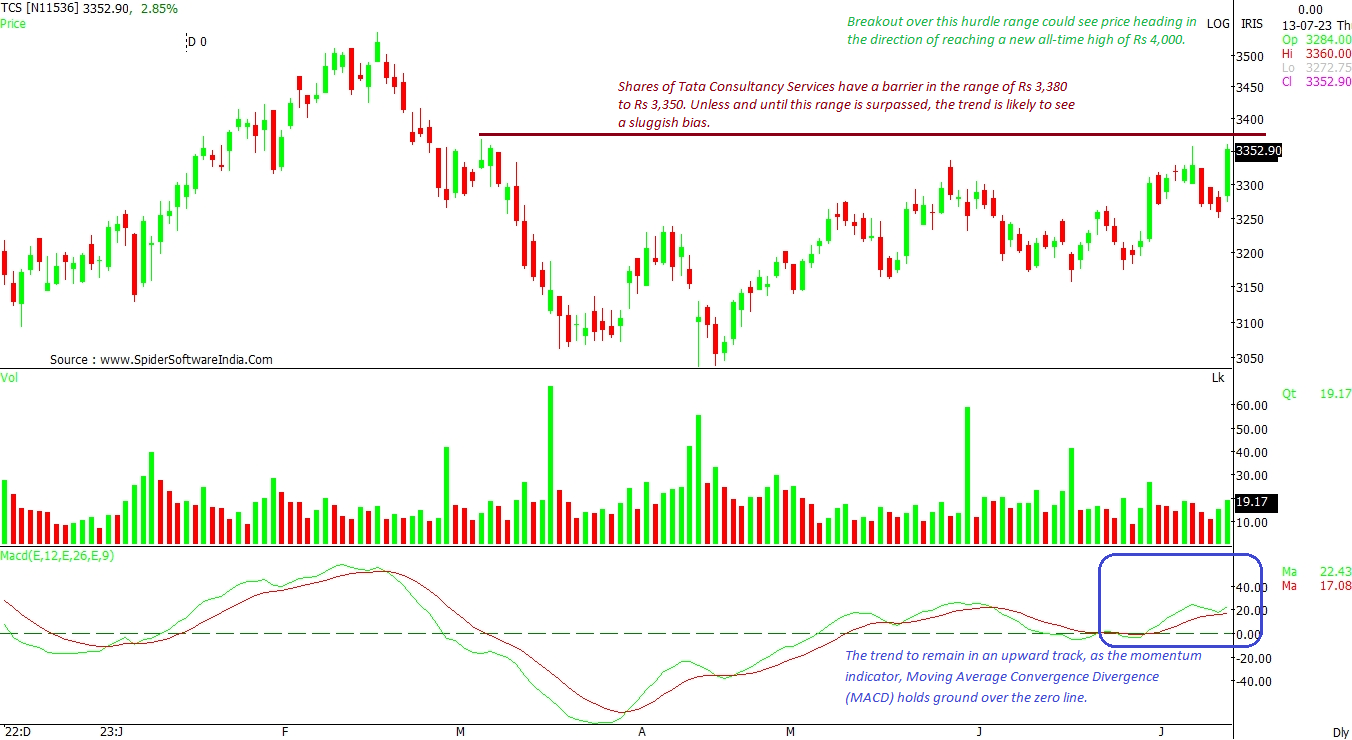
TCS may hit Rs 4,000-mark on Q1 boost; HCL Tech could dip to Rs 1,000 level

Once the range of Rs 3,380 to Rs 3,350 is conquered, TCS shares are set to hit a new historic peak. HCL Tech, meanwhile, may slip under Rs 1,000 if it fails to hold the 200-DMA

Q1 results
IT stocks
Avdhut Bagkar Mumbai
2 min read Last Updated : Jul 13 2023 | 11:19 AM IST
Shares of Tata Consultancy Services and HCL Technologies will be in limelight on Thursday, following their Q1FY24 results. Tata Consultancy Services’ shares opened on a strong note and were observed scaling previous significant high, while HCL Technologies, which began with a gap-down, quickly recovered losses perceiving a sluggish bias. 

The largest IT service provider, Tata Consultancy Services, reported 16.8% year-on-year (YoY) growth in the first quarter ended June of the fiscal year. The revenue grew by 7 per cent. 

HCL Technologies, the third largest company, delivered 12 per cent jump in its net profit in the fiscal quarter ended June 2023.

Here’s the technical outlook of these IT stocks post their corporate results:-

HCL Technologies Limited (HCLTECH)
Outlook: Stock requires to hold 200-DMA

Shares of HCL Technologies have violated the trend line support of Rs 1,160 in the previous sessions, triggering a negative bias. The stock has slipped under the 50-day moving average (DMA) and 100-DMA and is on track to test the support of 200-DMA set at Rs 1,072-mark.

Going ahead, if the stock fails to hold the 200-DMA support, a bearish bias could take over the counter resulting in a build-up of a bearish sentiment. The stock might hit Rs 1,000-mark. A sustained move over the said moving averages could recoup the positive bias. CLICK HERE FOR THE CHART

Tata Consultancy Services Ltd (TCS)
Outlook: Stock to set new historic peak once key hurdle range is crossed

Shares of Tata Consultancy Services have a barrier in the range of Rs 3,380 to Rs 3,350. Unless and until this range is surpassed, the trend is likely to see a sluggish bias.  Breakout over this hurdle range could see price heading in the direction of reaching a new all-time high of Rs 4,000.

So far, the support of Rs 3,250 could be utilized to keep the upside bias afloat. The trend to remain in an upward track, as the momentum indicator, Moving Average Convergence Divergence (MACD) holds ground over the zero line. CLICK HERE FOR THE CHART

One subscription. Two world-class reads.

Already subscribed? Log in

Subscribe to read the full story →
*Subscribe to Business Standard digital and get complimentary access to The New York Times

Smart Quarterly

₹900

3 Months

₹300/Month

SAVE 25%

Smart Essential

₹2,700

1 Year

₹225/Month

SAVE 46%
*Complimentary New York Times access for the 2nd year will be given after 12 months

Super Saver

₹3,900

2 Years

₹162/Month

Subscribe

Renews automatically, cancel anytime

Here’s what’s included in our digital subscription plans

Exclusive premium stories online

  • Over 30 premium stories daily, handpicked by our editors

Complimentary Access to The New York Times

  • News, Games, Cooking, Audio, Wirecutter & The Athletic

Business Standard Epaper

  • Digital replica of our daily newspaper — with options to read, save, and share

Curated Newsletters

  • Insights on markets, finance, politics, tech, and more delivered to your inbox

Market Analysis & Investment Insights

  • In-depth market analysis & insights with access to The Smart Investor

Archives

  • Repository of articles and publications dating back to 1997

Ad-free Reading

  • Uninterrupted reading experience with no advertisements

Seamless Access Across All Devices

  • Access Business Standard across devices — mobile, tablet, or PC, via web or app

Topics :TCSHCL TechQ1 resultsIT resultsStock brokingStock ideasStock Indicationstock movementstock market rallystock market tradingStock tipsstock market investingstocks technical analysistechnical analysisMarket technicalstechnical chartsDaily technicalstechnical calllsWeekly technicalTechniical calls

Next Story