YES Bank trades above 200-DMA for second straight day; eyes this target now
Technically, the stock seems on course to test ₹25.50 levels, above which a dash to ₹27.30 levels cannot be ruled out, shows the medium-term YES Bank chart.
Rex Cano Mumbai YES Bank stock rallied nearly 5 per cent to a high of ₹21.39 in intra-day deals on Tuesday, even as the benchmark indices traded with losses. The NSE Nifty 50 index was down over 1 per cent at 24,630 levels, while the banking barometer - Nifty Bank declined 0.7 per cent to 54,974.
The stock has surged over 17 per cent in the last three trading sessions after Japan-based Sumitomo Mitsui Banking Corporation (SMBC) agreed to buy a 20 per cent stake in YES Bank.
According to reports, in one of the largest cross-border deals in the Indian banking sector, State Bank of India (SBI) and seven private sector lenders will collectively
sell 20 per cent stake in YES Bank to SMBC for ₹13,482 crore.
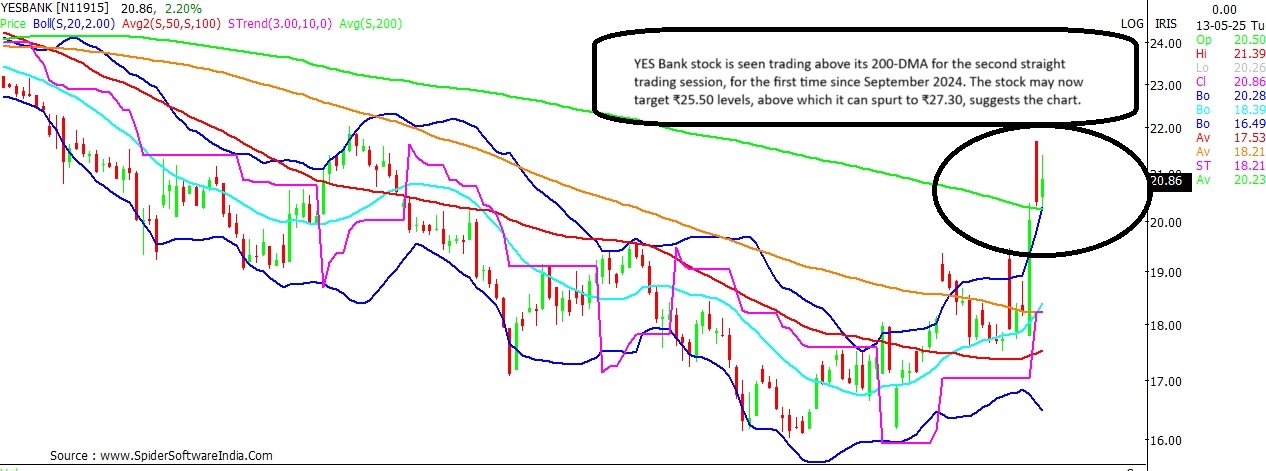
Amid the recent rally, YES Bank on Monday broke above its 200-Day Moving Average (200-DMA) for the first time since September 02, 2024. Today, for the second straight trading session the stock was seen trading above this key long-term moving average, which stands at ₹20.23.
Technically, sustained trade above the 200-DMA shall augur well for the YES Bank stock going ahead. Here's what could happen next as per the chart patterns.
ALSO READ | These 3 technical factors working in favour of these 5 stocks; how to trade? YES Bank Current Price: ₹20.86
Upside Potential: 31%
Support: ₹20.40; ₹20.23; ₹20
Resistance: ₹23.13; ₹24.10; ₹25.50
Technical chart shows that
YES Bank stock is not only trading above its 200-DMA, but also the higher-end of the Bollinger Bands on the daily scale. Thus, the near-term bias is expected to remain positive as long as the stock sustains above ₹20.40 - ₹20.23 levels. Below which, support for the stock can be anticipated around ₹20.
In case, the stock breaks and trades consistently below the ₹20-mark, it could then enter a phase of consolidation. For now, the stock seems to be in an uptrend, and could potentially target ₹25.50 levels; above which a spurt to ₹27.30 seems likely.
The stock may face interim resistance around ₹23.13 and ₹24.10 levels, shows the medium-term chart.
CLICK HERE FOR THE CHART  "YES Bank trades above 200-DMA for second straight day; eyes this target now")
