Planning Commission estimates show sharp fall in poverty rate
Peg decline at 7.8 percentage points between 2009-10 and 2011-12
Sanjeeb Mukherjee New Delhi The poverty rate has declined by 7.8 percentage points in two years, according to the latest estimates by the Planning Commission. If 29.8 per cent of the population was poor in 2009-10, the figure came down to 22 per cent in 2011-12. The estimates are based on the recently-released report by the National Sample Survey Office (NSSO) for 2011-12.
This means, those living in poverty declined by 3.9 percentage points a year between 2009-10 and 2011-12. This is probably the fastest rate of poverty reduction in India. Those living below poverty line declined by 7.4 percentage points in five years from 37.2 per cent in 2004-05 to 29.8 per cent in 2009-10. Between 2004-05 and 2009-10, Bihar and Gujarat saw the fastest decline in the poverty rates. Usually, poverty rates are calculated in a gap of five years. However, NSSO conducted a survey for consumption expenditure for 2011-12 as 2009 was a drought year.
The fast rate of poverty reduction cannot be attributed to economic growth alone, since gross domestic product expansion fluctuated sharply in 2010-11 and 2011-12.
The economy grew 9.3 per cent in 2010-11, but slowed down significantly to 6.2 per cent in 2011-12, a growth less than even 2008-09 when India faced the ripple effects of global financial crisis.
However, these estimates are based on the Suresh Tendulkar committee report. Poverty line based on the committee recommendations for 2009-10 had stirred a controversy last year. The Planning Commission drew criticism as it fixed poverty line at Rs 28.65 per capita daily consumption in urban areas and Rs 22.42 in villages. The Planning Commission did not disclose the poverty line for 2011-12.
After drawing flak, the government had appointed a committee headed by Prime Minister’s Economic Advisory Council (PMEAC) Chairman C Rangarajan to come out with a new methodology for calculating poverty. The panel is yet to submit its report.
Commenting on the estimates, Planning Commission Deputy Chairman Montek Singh Ahluwalia said “whatever method you apply and wherever you keep the poverty line, poverty has indeed declined”.
Even though the poverty reduction was the fastest in two years between 2009-10 and 2011-12, India still had approximately 268.9 million poor people in 2011-12. Around 344.7 million people were poor in 2009-10, lower than 407.3 million in 2004-05. “Poverty fell at a faster rate between 2009-10 and 2011-12, mainly because 2009-10 was a particularly bad year due to drought, which also shows that despite one of the worst droughts in decades in India, rural population might have spent less in anticipation of a crisis,” said Planning Commission member Saumitra Chaudhuri.
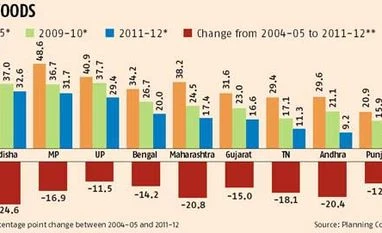
State-wise, the data showed that those in poverty in Bihar declined from 54.4 per cent of the population in 2004-05 to 37.9 per cent in 2009-10 and, thereafter, to 33.7 per cent in 2011-12.
In Uttar Pradesh, those below the poverty line fell from 40.9 per cent of the population in 2004-05 to 29.4 per cent in 2011-12. In Gujarat, it fell from 31.6 per cent of the population in 2004-05 to 16.6 per cent in 2011-12. In 2009-10, 23 per cent of Gujarat’s total population was below poverty line.
Chaudhuri said the data also showed the rural poverty in Punjab was coming down at a faster rate than the urban poverty rate.
 "Planning Commission estimates show sharp fall in poverty rate")