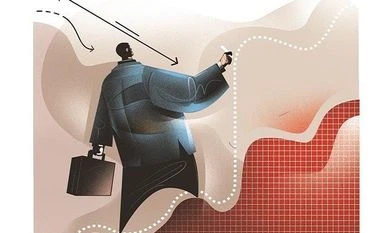
Covid cases slipped below the six-figure mark on June 7 and have generally been showing a downward drift for much of the week ending Sunday. There was a corresponding improvement in weekly indicators of economic activity. People spent more time out of home than they did since April this year. Using anonymised location data, search engine Google tracks how people are moving during the pandemic. Visits to workplaces have gone up. Travel in general seems to have improved with more people turning up at transit stations like subways, buses and trains. Parks have also seen more visitors (see chart 1). Google data is released with a lag. The latest is as of June 8. All other data is as of Sunday, June 13.
There has also been an increase in traffic congestion, which is tracked by global location technology firm TomTom International. Traffic went up for the fourth week in a row in both Mumbai and New Delhi.
However, both cities still have only around half the traffic that they did during the same time in 2019. New Delhi's traffic recovery is slightly behind that of Mumbai's as of now (see chart 2) relative to 2019. Mumbai also recorded higher emissions of nitrogen dioxide, a pollutant that comes from industrial activity and vehicles. Delhi’s emissions are lower than they were in 2019. They are down around 40 per cent now, compared to 48 per cent in the beginning of May when Covid cases were in excess of 350,000 a day (see charts 3, 4).
The Indian Railways continued to show double-digit growth. It carried around 30 per cent more goods than in the same week last year. The earnings from the goods carried was around 41.5 per cent higher (see chart 5). Power demand, too, continued its upward trend as more states eased lockdown restrictions and allowed more commercial activity. Electricity generation was up 5 per cent last week on a sequential basis. It was up by around 11.3 per cent year-on-year compared to the corresponding week in 2020, but it was lower by around 5 per cent compared to the corresponding week in 2019 (see chart 6).
Business Standard tracks these economic indicators every week. They give a sense of how economic activity changes with the ebb and flow of Covid-19 cases. Official macroeconomic data is often released with a lag.
Analysts globally have been relying on these indicators to get a sense of the economy ahead of official data, as countries across the world faced similar shutdowns to control the pandemic.
One subscription. Two world-class reads.
Already subscribed? Log in
Subscribe to read the full story →
Smart Quarterly
₹900
3 Months
₹300/Month
Smart Essential
₹2,700
1 Year
₹225/Month
Super Saver
₹3,900
2 Years
₹162/Month
Renews automatically, cancel anytime
Here’s what’s included in our digital subscription plans
Exclusive premium stories online
Over 30 premium stories daily, handpicked by our editors


Complimentary Access to The New York Times
News, Games, Cooking, Audio, Wirecutter & The Athletic
Business Standard Epaper
Digital replica of our daily newspaper — with options to read, save, and share


Curated Newsletters
Insights on markets, finance, politics, tech, and more delivered to your inbox
Market Analysis & Investment Insights
In-depth market analysis & insights with access to The Smart Investor


Archives
Repository of articles and publications dating back to 1997
Ad-free Reading
Uninterrupted reading experience with no advertisements


Seamless Access Across All Devices
Access Business Standard across devices — mobile, tablet, or PC, via web or app
)