ACC, TaMo: These 5 cyclical stocks are showing upside bias on charts

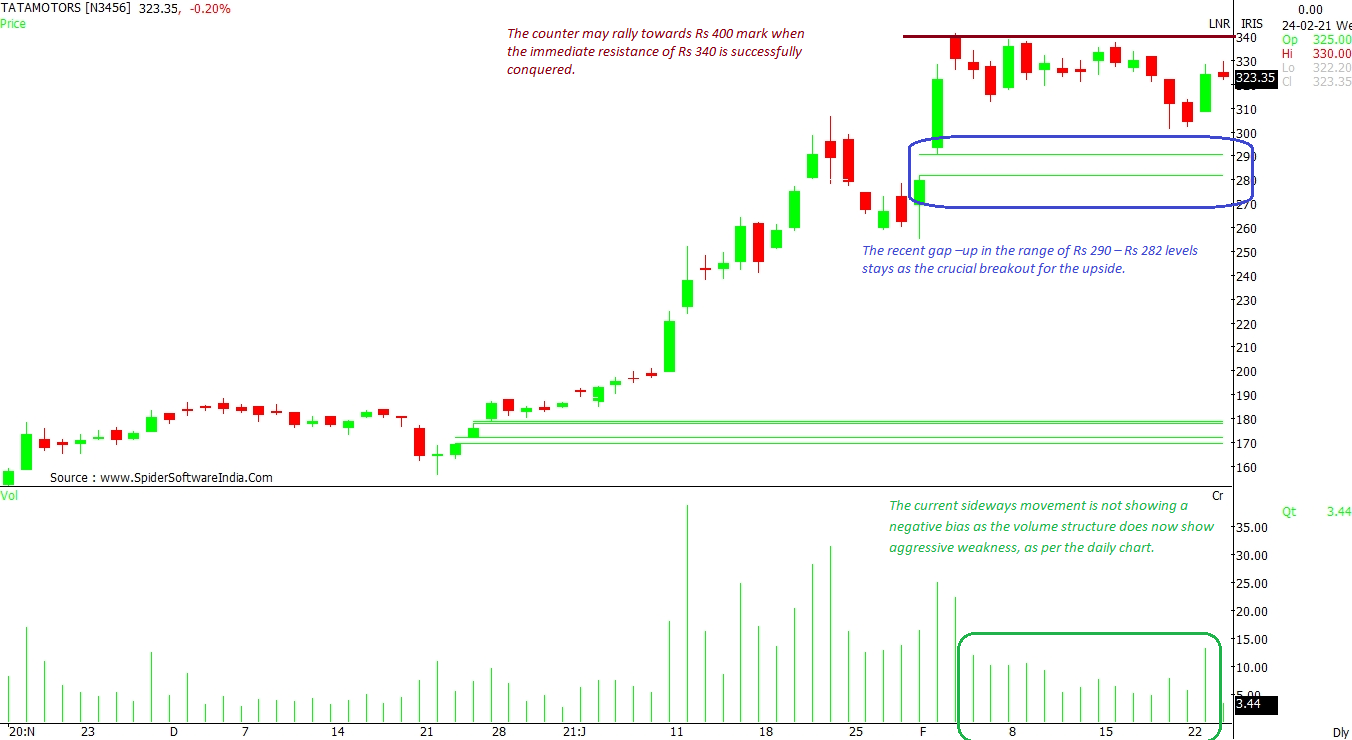
The recent gap-up in the range of Rs 290 - Rs 282 levels remains the crucial breakout for the upside in Tata Motors

markets, stock market, sensex, correction, nifty, shares, growth, profit, economy, gain
Avdhut Bagkar Mumbai
3 min read Last Updated : Feb 24 2021 | 12:47 PM IST
ACC Ltd (ACC):  Since June 2020, this counter has gradually been rising with the support of the 100-day moving average (DMA) currently placed at Rs 1,664 levels, as per the daily chart. On the higher side, some selling pressure can be observed around Rs 1,800 levels. Unless the counter conquers this resistance, the upside bias may witness profit booking. A successful close above Rs 1,800 means a breakout towards Rs 2,100 and Rs 2,400 mark. CLICK HERE FOR THE CHART
 
Tata Motors Ltd (TATAMOTORS):  The recent gap-up in the range of Rs 290 – Rs 282 levels remains the crucial breakout for the upside. The counter may rally towards Rs 400 mark once the immediate resistance of Rs 340 is successfully conquered. The current sideways movement is not showing a negative bias as the volume structure does now show aggressive weakness, as per the daily chart. CLICK HERE FOR THE CHART
 
DLF Ltd (DLF): This counter has a strong support of Rs 285 levels. Until this support is held, the upside momentum may see a rally towards Rs 345 and Rs 361 levels. Although, one can see a bearish divergence of RSI, the stock price is not showing aggravated weakness, as per the daily chart. The overall trend is bullish with the counter witnessing “higher high, higher low” formation. CLICK HERE FOR THE CHART
 
Larsen & Toubro Ltd (LT): The recent strong rally was close to the all-time high of Rs 1,607 levels. This move showed that the sentiment is on the bullish side, with market participants expecting a breakout with a new all-time high. The immediate support comes at Rs 1,391 levels, which is its 50-DMA. The overall trend is indicating a rally towards Rs 2,000 and Rs 2,100 mark, as per the monthly chart. CLICK HERE FOR THE CHART
 
Bank of Baroda (BANKBARODA): With a double bottom formation in the monthly chart, this counter is heading towards the resistance of Rs 108 levels. Similarly, the Moving Average Convergence Divergence (MACD) has formed a positive crossover, indicating that the direction and momentum are likely to remain on the ascending side. The Relative Strength Index (RSI) has crossed the mid-way mark of 50 value and is not showing any weakness. Unless a decisive breakdown below Rs 82 occurs, the trend is expected to be bullish, as per the monthly and weekly charts. CLICK HERE FOR THE CHART


One subscription. Two world-class reads.

Already subscribed? Log in

Subscribe to read the full story →
*Subscribe to Business Standard digital and get complimentary access to The New York Times

Smart Quarterly

₹900

3 Months

₹300/Month

SAVE 25%

Smart Essential

₹2,700

1 Year

₹225/Month

SAVE 46%
*Complimentary New York Times access for the 2nd year will be given after 12 months

Super Saver

₹3,900

2 Years

₹162/Month

Subscribe

Renews automatically, cancel anytime

Here’s what’s included in our digital subscription plans

Exclusive premium stories online

  • Over 30 premium stories daily, handpicked by our editors

Complimentary Access to The New York Times

  • News, Games, Cooking, Audio, Wirecutter & The Athletic

Business Standard Epaper

  • Digital replica of our daily newspaper — with options to read, save, and share

Curated Newsletters

  • Insights on markets, finance, politics, tech, and more delivered to your inbox

Market Analysis & Investment Insights

  • In-depth market analysis & insights with access to The Smart Investor

Archives

  • Repository of articles and publications dating back to 1997

Ad-free Reading

  • Uninterrupted reading experience with no advertisements

Seamless Access Across All Devices

  • Access Business Standard across devices — mobile, tablet, or PC, via web or app

Topics :MarketsBuzzing stocksstocksACCTata MotorsDLFLarsen & Toubro

Next Story