Home / Markets / News / Are IndiGo, SpiceJet and IRCTC a good contrarian bet? What charts say
Are IndiGo, SpiceJet and IRCTC a good contrarian bet? What charts say
As the nation-wide lockdown enters its fourth phase, albeit with some relaxations, air and rail travel continues to be suspended. Most of the related stocks in these two sectors have taken a hit
As the nation-wide lockdown enters its fourth phase, albeit with some relaxations, air and rail travel continues to be suspended. Most of the related stocks in these two sectors have taken a hit at the bourses over the past few weeks.
Does the fall in these counters present a good entry point for someone who is willing to hold these for the next 12 - 24 months? Here's how they look on the technical charts.
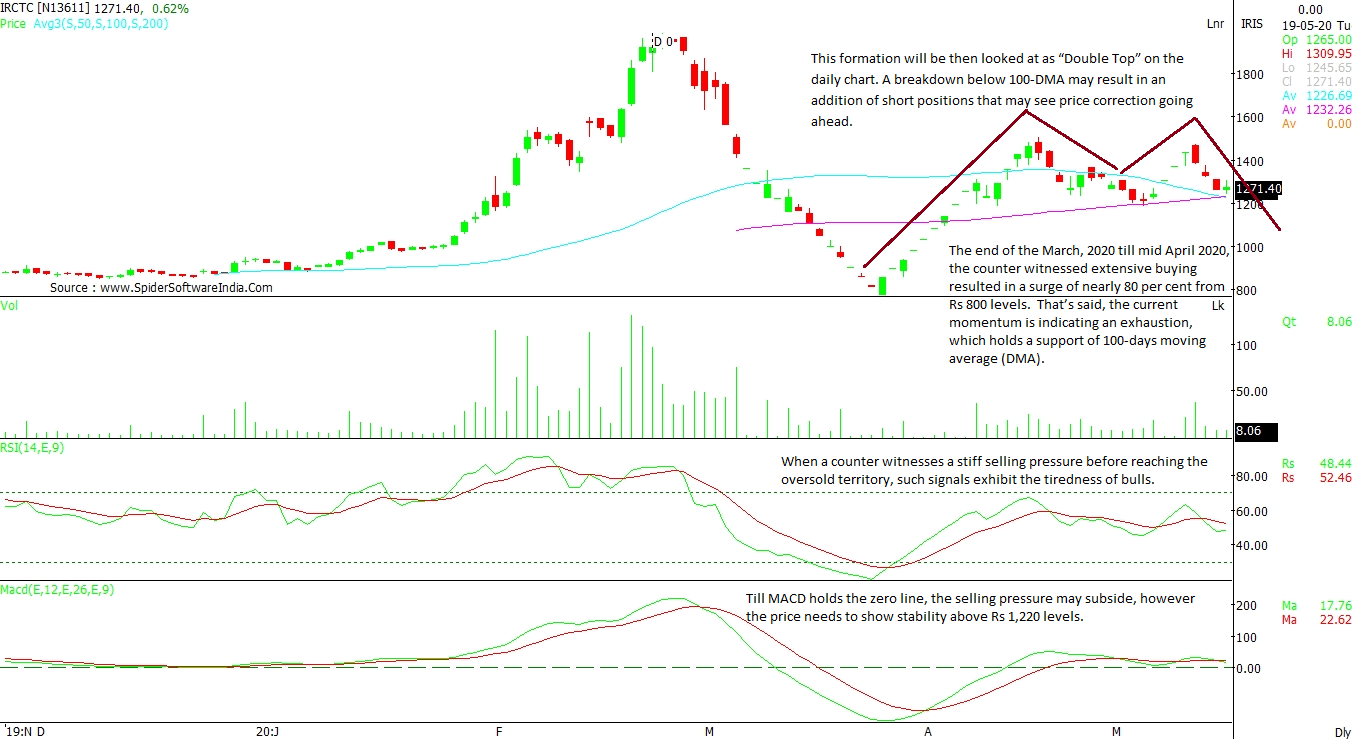
Indian Railway Ctrng nd Trsm Corp Ltd (IRCTC): The stock witnessed a rally of around 80 per cent from its March 2020 low of Rs 800 levels till mid April 2020. Given suhc a massive move, the counter is now showing signs of exhaustion, but is holding on to the support of 100-days moving average (DMA). Going forward, if the counter breaks the 100-DMA placed at Rs 1,220 then a selling may intensify and can tarke the stock towards Rs 1,000 levels. The current formation indicates a “Double Top” on the daily chart. A breakdown may result in an addition of short positions, which may see a price correction going ahead.
Another technical indicator - Relative Strength Index (RSI) - has seen a reversal nearing the oversold condition. When counter witness a stiff selling pressure before reaching the oversold territory, such signals exhibit the tiredness of bulls. The follow-up buying has not happened; this in turn resulted in a price correction. Now with a negative crossover of RSI, the price is set to test the support of 100-DMA.
The Moving Average Convergence Divergence (MACD) trades above the zero line. Till it holds the this line, the selling pressure may subside. However the price needs to show stability above Rs 1,220 levels. The MACD represents strength, direction and momentum. A regular trade above the zero line can be considered as a positive signal, provided the level holds. CLICK HERE FOR THE CHART
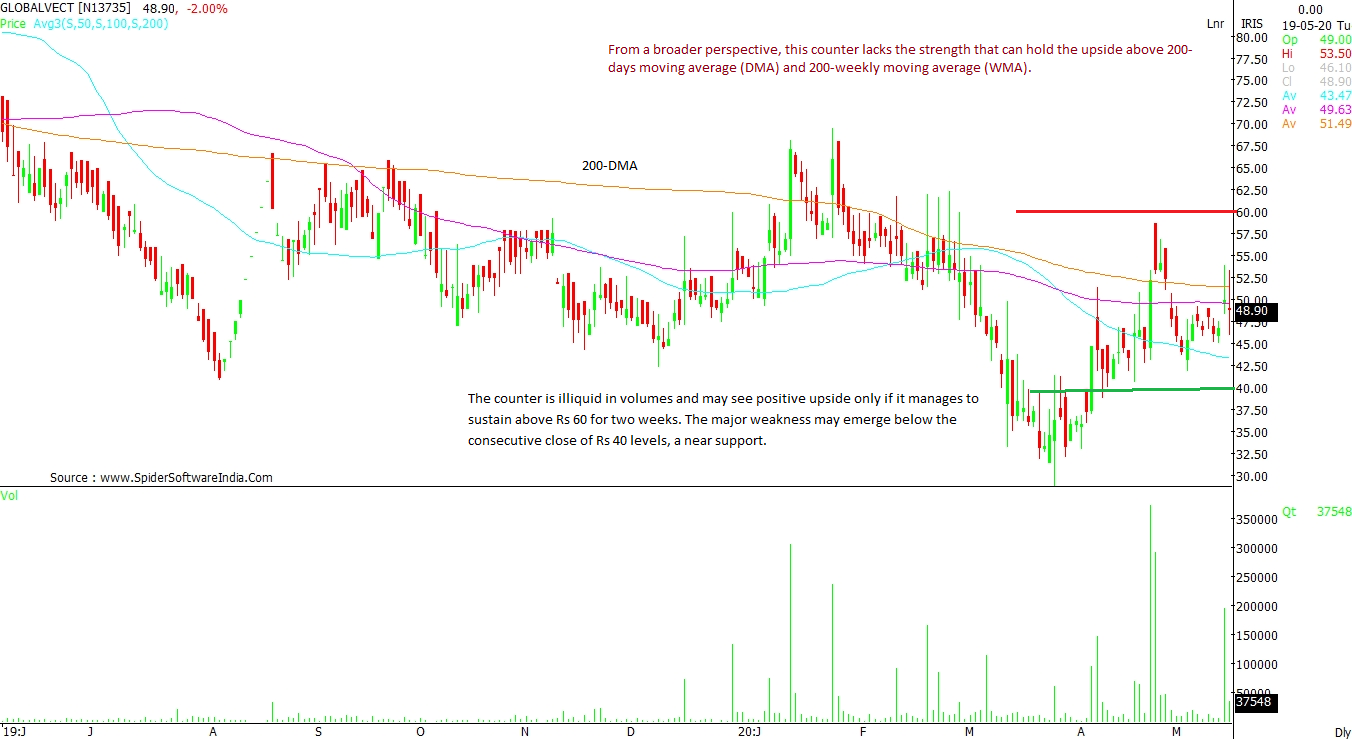
Global Vectra Helicorp Limited (GLOBALVECT): From a broader trading perspective, this counter lacks the strength that can trigger an upside above 200-days moving average (DMA) and 200-weekly moving average (WMA). Everytime it attempts to cross these averages, a sudden selling pressure pushes the price downward. The counter is illiquid and may see an upside only if it manages to sustain above Rs 60 for two weeks. A major weakness may emerge below if the counter sees consecutive close below Rs 40 levels, which is a near support for this stock. CLICK HERE FOR THE CHART
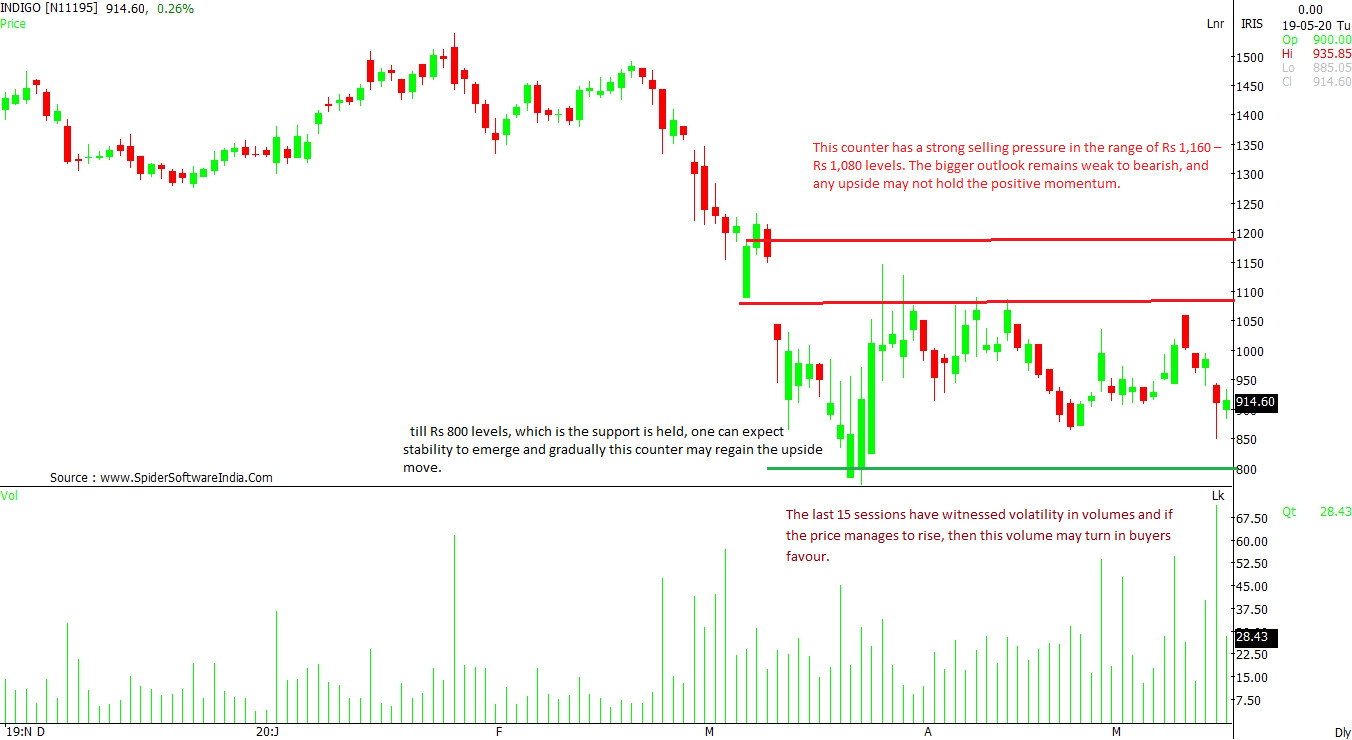
InterGlobe Aviation Ltd (INDIGO): This stock faces a strong selling pressure in the range of Rs 1,160 – Rs 1,080 levels. The bigger outlook remains weak and any upside may not hold for long. As per the daily chart, the counter has been unable to hold on to higher levels, but a sharp fall below Rs 800 levels, which is the supportis ruled out for now. The last 15 sessions have seen volatility in volumes and if the price manages to rise over the next few sessions, then it may also find volume support. CLICK HERE FOR THE CHART
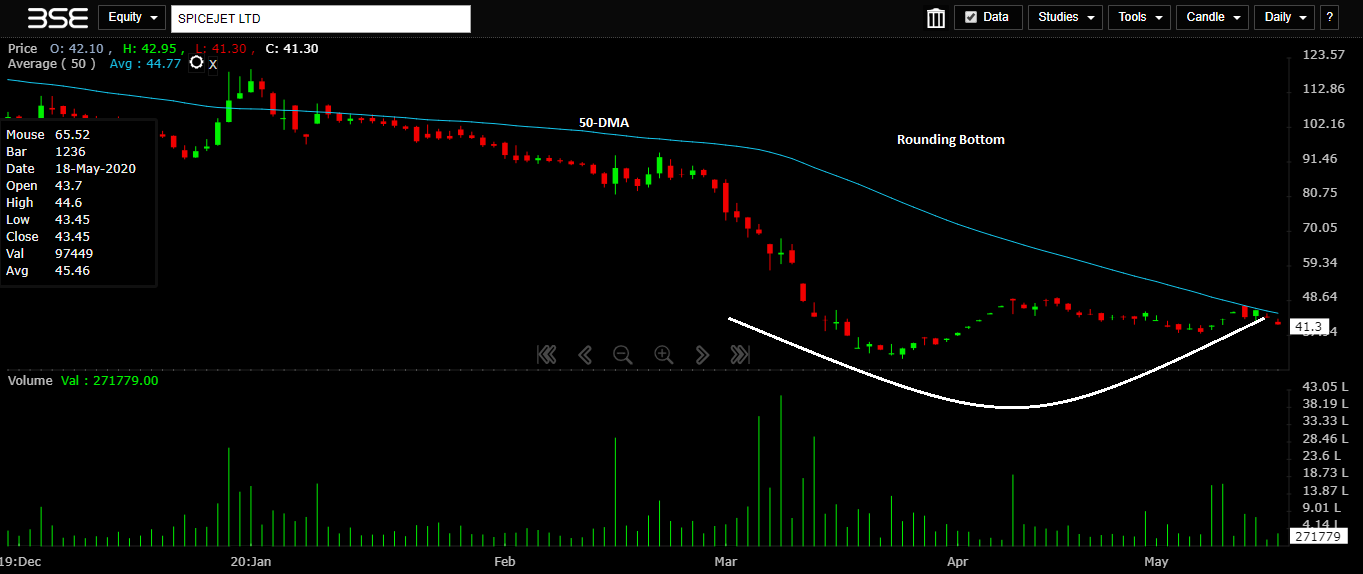
SpiceJet Ltd (SPICEJET): A rounding bottom formation could be formed in the sessions ahead, indicates daily chart. This can be possible if the stock is able to stay above its support of Rs 38. On the upside, the breakout neckline is placed at Rs 50 levels. The current momentum indicates that the counter is attempting to cross 50-DMA place at Rs 44.75 levels. The volumes have remained stagnant; price may see upside if the volumes support and gradually rise over time. CLICK HERE FOR THE CHART
Enable GingerCannot connect to Ginger Check your internet connection
or reload the browserDisable in this text fieldEditEdit in GingerEdit in Ginger×Enable GingerCannot connect to Ginger Check your internet connection
or reload the browserDisable in this text fieldEditEdit in GingerEdit in Ginger×Enable GingerCannot connect to Ginger Check your internet connection
or reload the browserDisable in this text fieldEditEdit in GingerEdit in Ginger×
Read this article for free
Register to continue reading premium journalism and analysis from Business Standard.
 "Are IndiGo, SpiceJet and IRCTC a good contrarian bet? What charts say")


