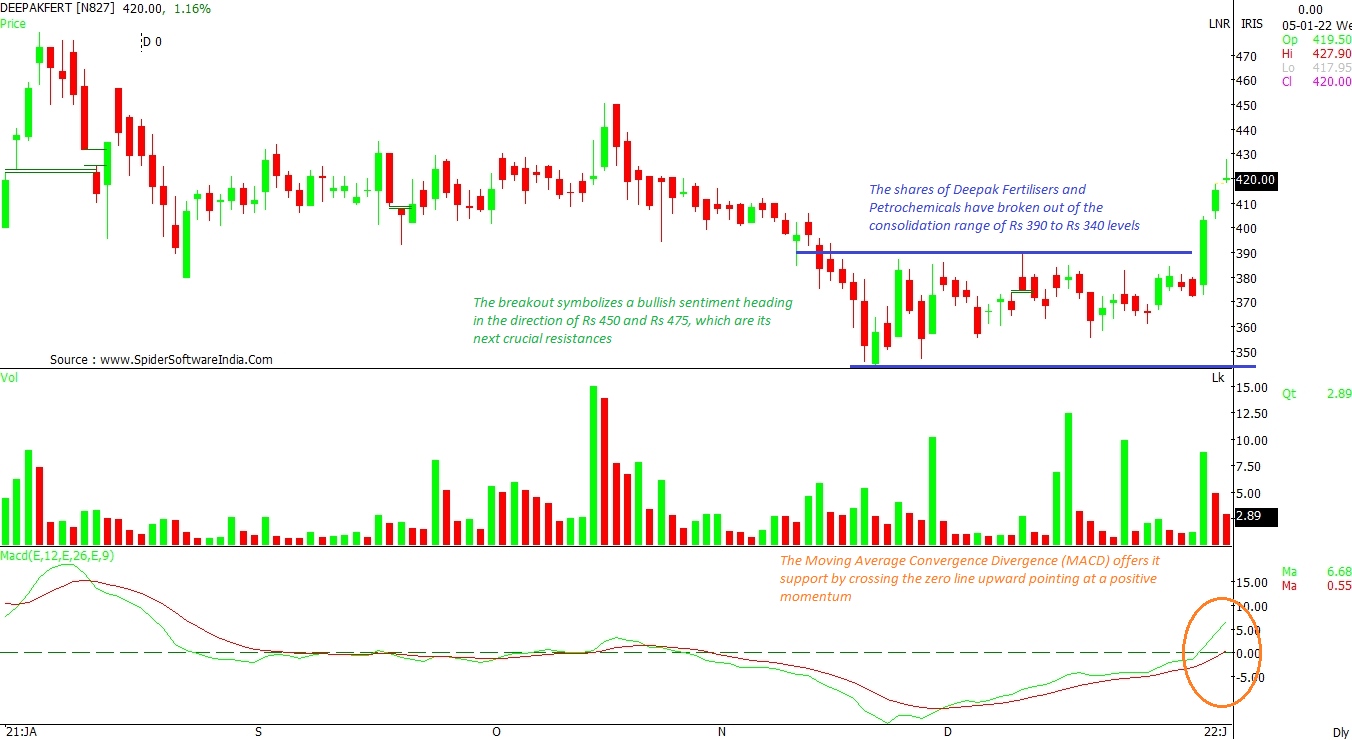
The shares of Deepak Fertilisers and Petrochemicals have broken out of the consolidation range of Rs 390 to Rs 340 levels, according to the daily chart. This symbolizes a bullish sentiment heading in the direction of Rs 450 and Rs 475,which are its next crucial resistances. The Moving Average Convergence Divergence (MACD) offers it support by crossing the zero line upward pointing at a positive momentum. The immediate support comes at Rs 410 and Rs 400 levels. CLICK HERE FOR THE CHART
Madras Fertilizers Ltd (MADRASFERT)
Likely target: Rs 34 and and Rs 36
Upside potential: 9% to 16%
Shares of Madras Fertilizers are likely to attempt to conquer the significant hurdle at Rs 31-level. As and when that happens, the stock will not only breakout on upside, but will also manage to sustain above its 200-day moving average (DMA) indicating a robust outlook. This momentum may lead to Rs 34 and and Rs 36, its next obstacle marks. The immediate support is positioned at Rs 29.30, which is the 200-DMA. CLICK HERE FOR THE CHART
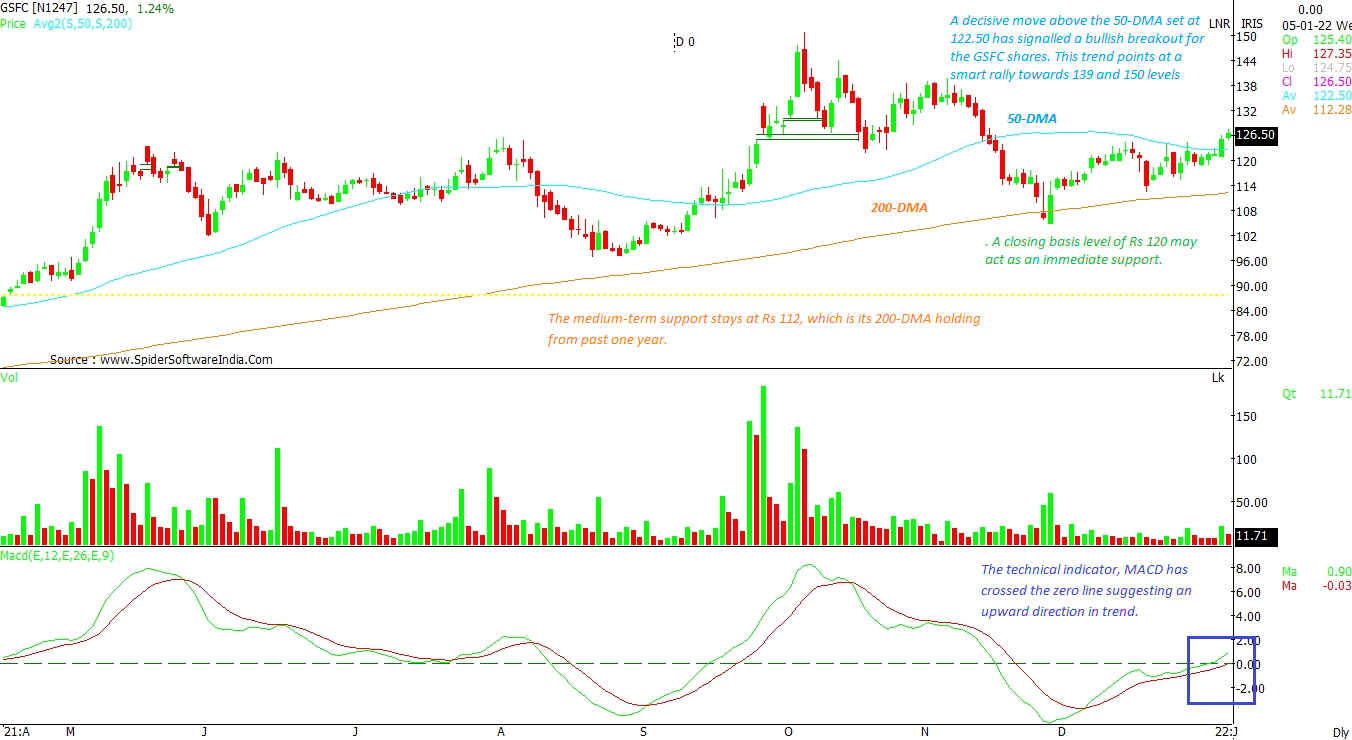
Gujarat State Fertilizers & Chemicals Limited (GSFC)
Likely target: Rs 139 and Rs 150
Upside potential: 10% to 18%
A decisive move above the 50-DMA set at Rs 122.50 has signalled a bullish breakout for the GSFC shares. This trend points at a smart rally towards Rs 139 and Rs 150 levels, according to the daily and weekly charts. A closing basis level of Rs 120 may act as an immediate support. The technical indicator, MACD has crossed the zero line suggesting an upward direction in trend. The medium-term support stays at Rs 112, which is its 200-DMA holding from past one year. CLICK HERE FOR THE CHART
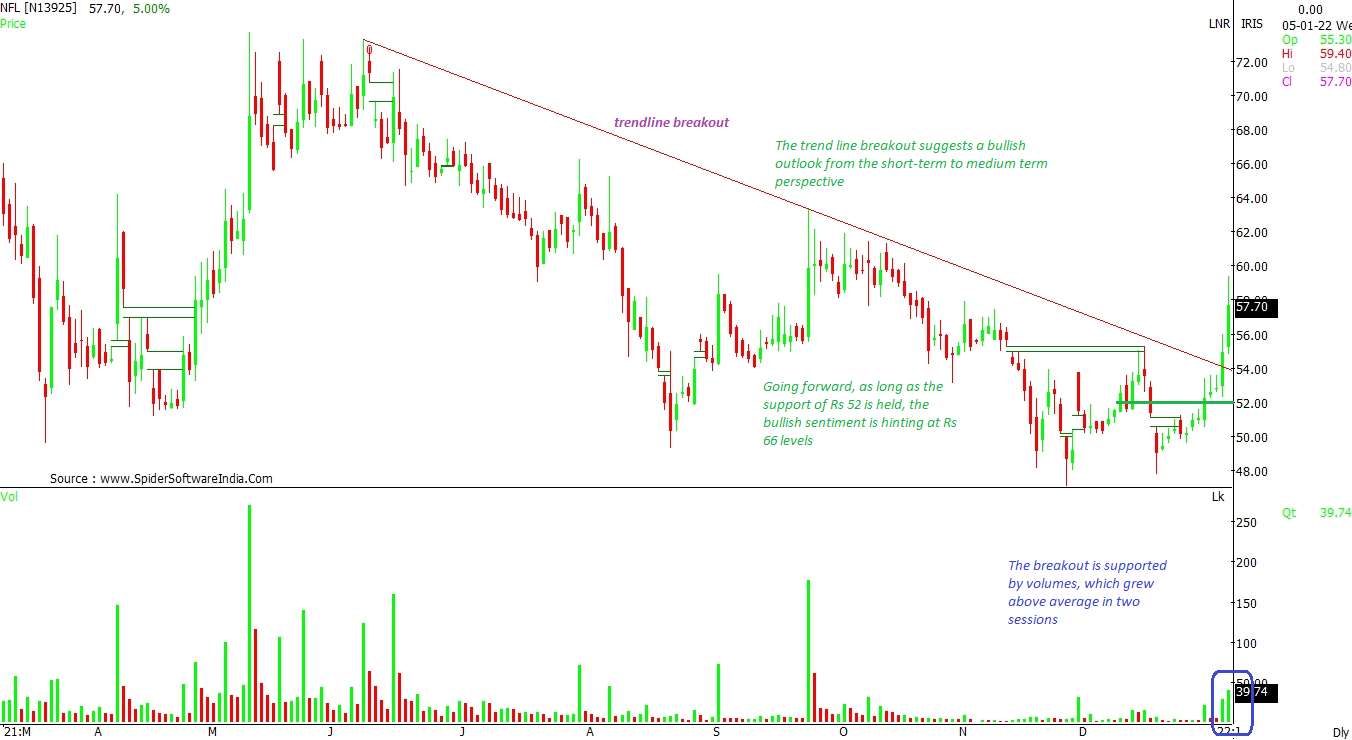
National Fertilizers Ltd (NFL)
Likely target: Rs 66
Upside potntiale: 14%
The trend line breakout suggests a bullish outlook from the short-term to medium term perspective. This breakout is supported by volumes, which grew above average in two sessions. Going forward, as long as the support of Rs 52 is held, the bullish sentiment is hinting at Rs 66 levels, as per the daily chart. CLICK HERE FOR THE CHART
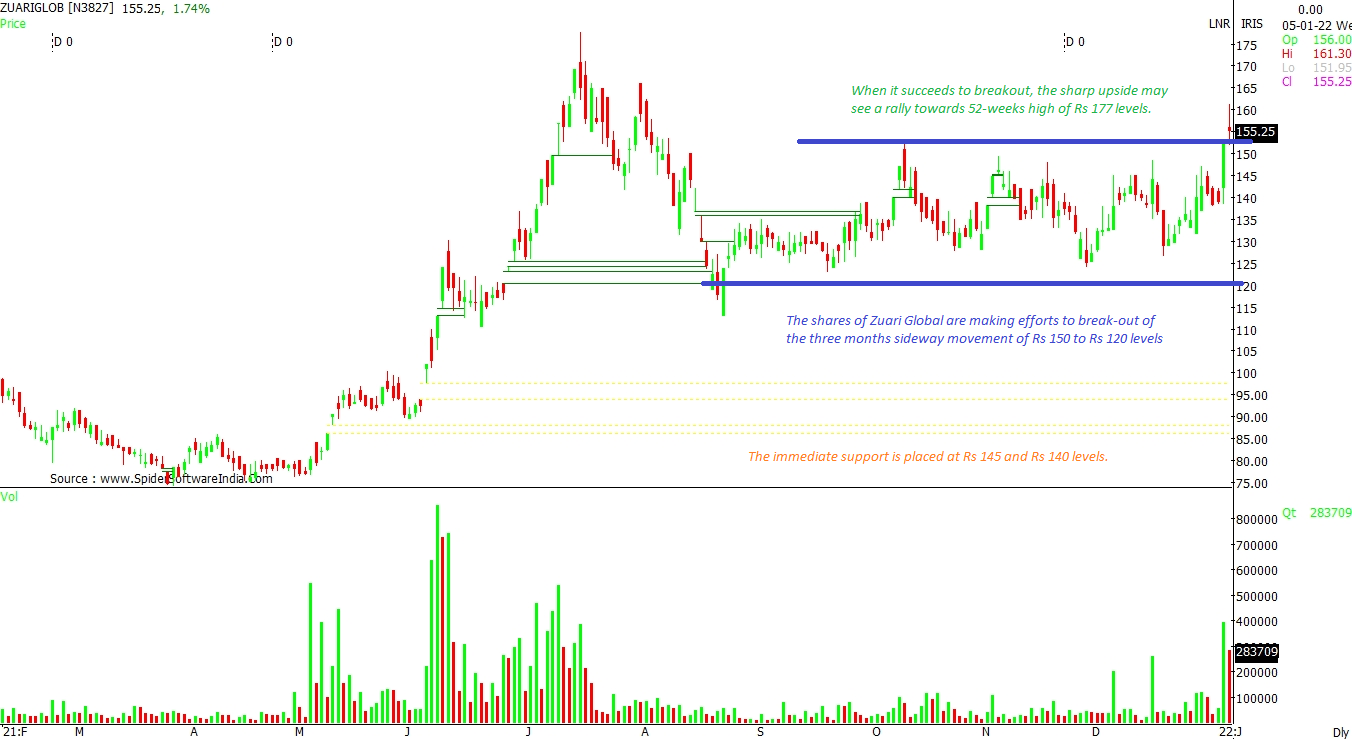
Zuari Global Ltd (ZUARIGLOB)
Likely target: Rs 177
Upside potential: 14%
The shares of Zuari Global are making efforts to break-out of the three months sideway movement of Rs 150 to Rs 120 levels, as shown in the daily chart. When it succeeds, the sharp upside may see a rally towards the 52-week high of Rs 177 levels. The immediate support is placed at Rs 145 and Rs 140 levels. CLICK HERE FOR THE CHART
Read this article for free
Register to continue reading premium journalism and analysis from Business Standard.
 "Chart Check: Zuari Global, GSFC, Deepak Fertilisers can rally up to 18%")


