Among individual stocks, ICICI Bank, IndusInd Bank, Bajaj Finserv, State Bank of India, Shriram City Union Finance, RBL Bank, and IDBI Bank rallied more than 10 per cent on the National Stock Exchange (NSE). Besides, LIC Housing Finance, AU Small Finance Bank, Bank of India, Housing Development Finance Corporation (HDFC), and Bank of Baroda surged between 7 per cent and 10 per cent.
Here's how Nifty Bank index and some bank stocks look on charts
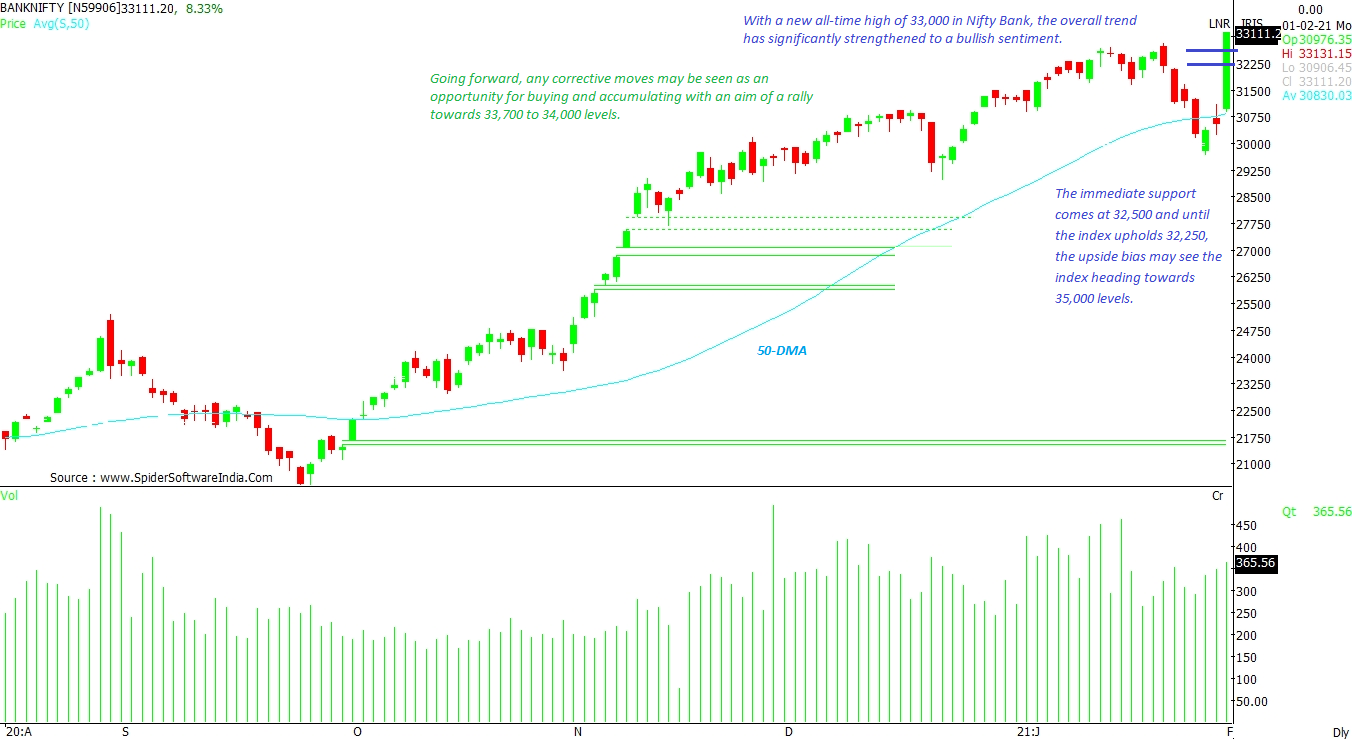
NIFTYBANK: With a new all-time high of 33,000 in the Nifty Bank index, the overall trend has significantly strengthened to bullish sentiment. Going forward, any corrective move may be seen as an opportunity for buying and accumulating with an aim for a rally towards 33,700 to 34,000 levels. The immediate support comes at 32,500 and until the index holds 32,250, the upside bias may see the index heading towards 35,000 levels.
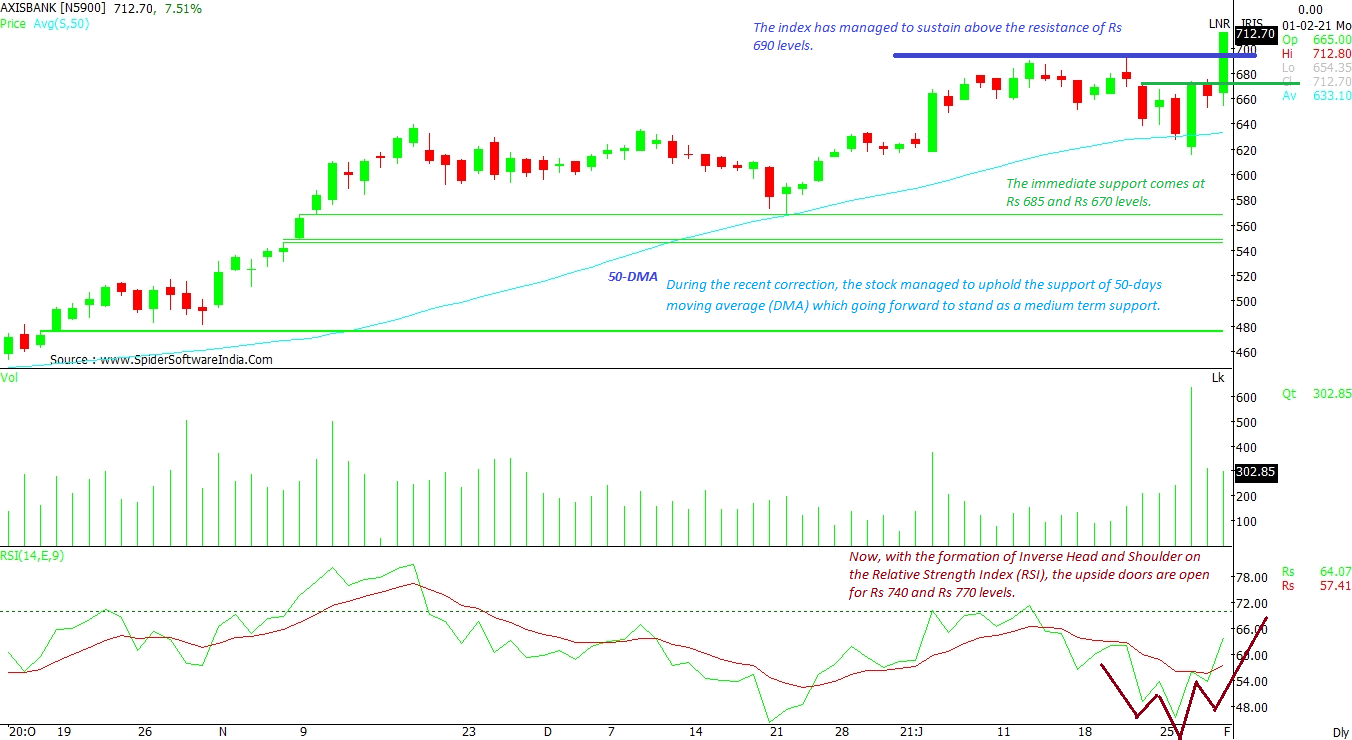
CLICK HERE FOR THE CHART Axis Bank Ltd (AXISBANK): The index has managed to sustain above the resistance of Rs 690 levels. Now, with the formation of Inverse Head and Shoulder on the Relative Strength Index (RSI), the upside doors are open for Rs 740 and Rs 770 levels. The immediate support comes at Rs 685 and Rs 670 levels. During the recent correction, the stock managed to uphold the support of 50-day moving average (DMA), which, going forward, will act as medium-term support.
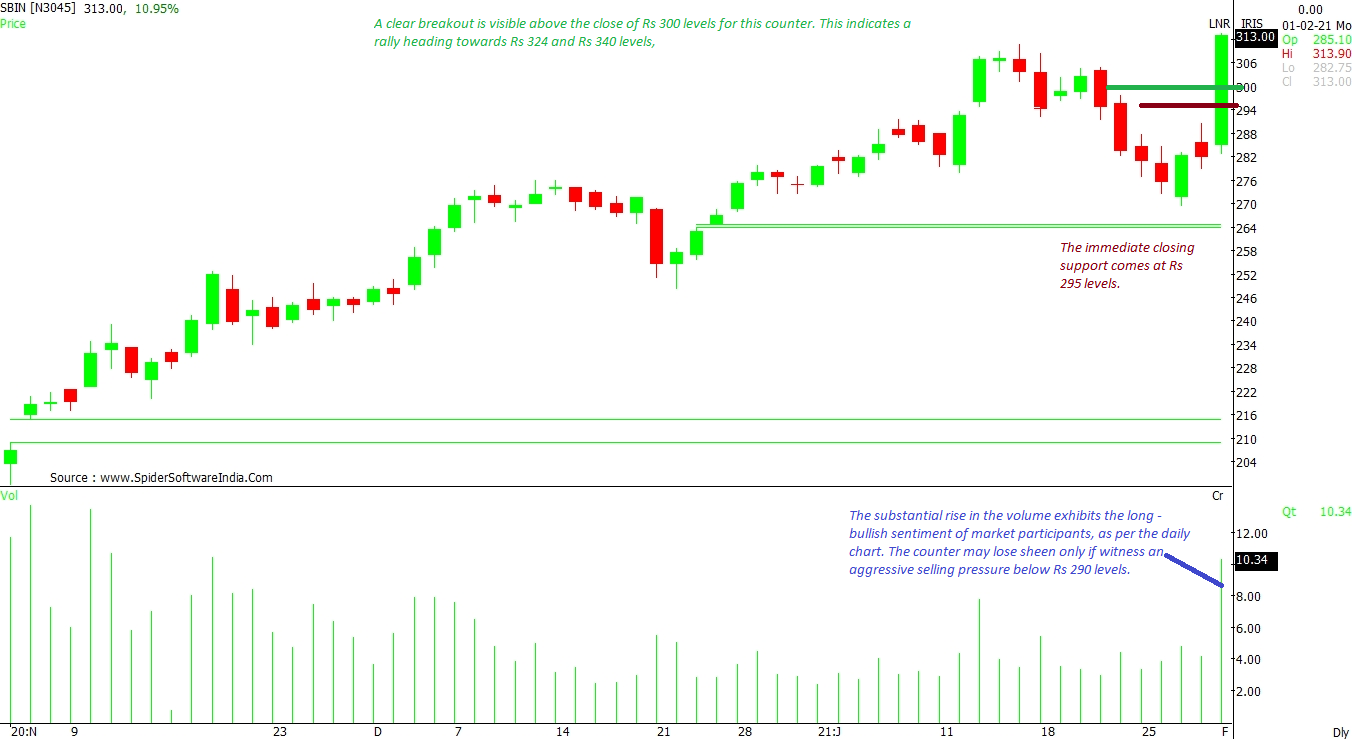
CLICK HERE FOR THE CHART State Bank of India (SBIN): A clear breakout is visible above the close of Rs 300 levels for this counter. This indicates a rally heading towards Rs 324 and Rs 340 levels, as per the daily chart. The immediate closing support comes at Rs 295 levels. The substantial rise in the volume exhibits the long - bullish sentiment of market participants, as per the daily chart. The counter may lose sheen only if it witnesses aggressive selling pressure below Rs 290 levels.
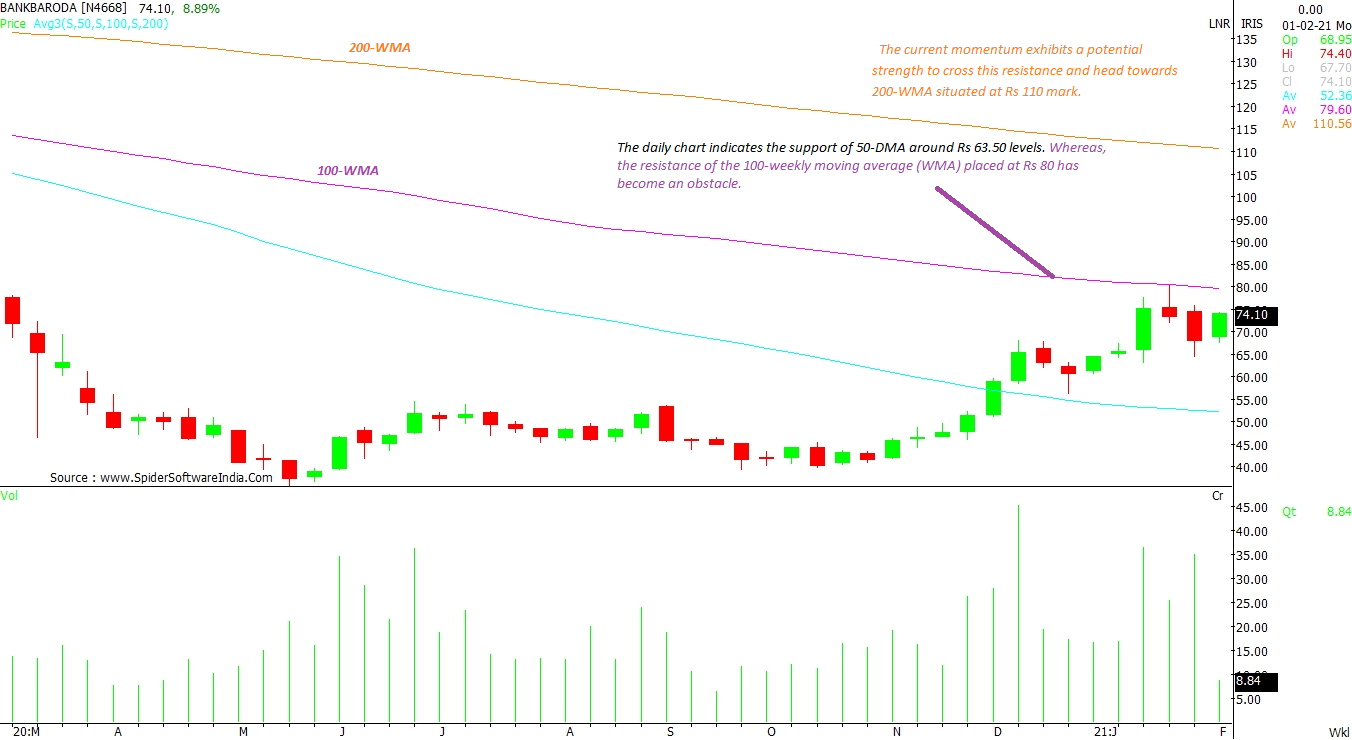
CLICK HERE FOR THE CHART Bank of Baroda (BANKBARODA): The daily chart indicates the support of 50-DMA around Rs 63.50 levels. Whereas, the resistance of the 100-weekly moving average (WMA), placed at Rs 80, has become an obstacle. The current momentum exhibits a potential strength to cross this resistance and head towards 200-WMA situated at Rs 110 mark.
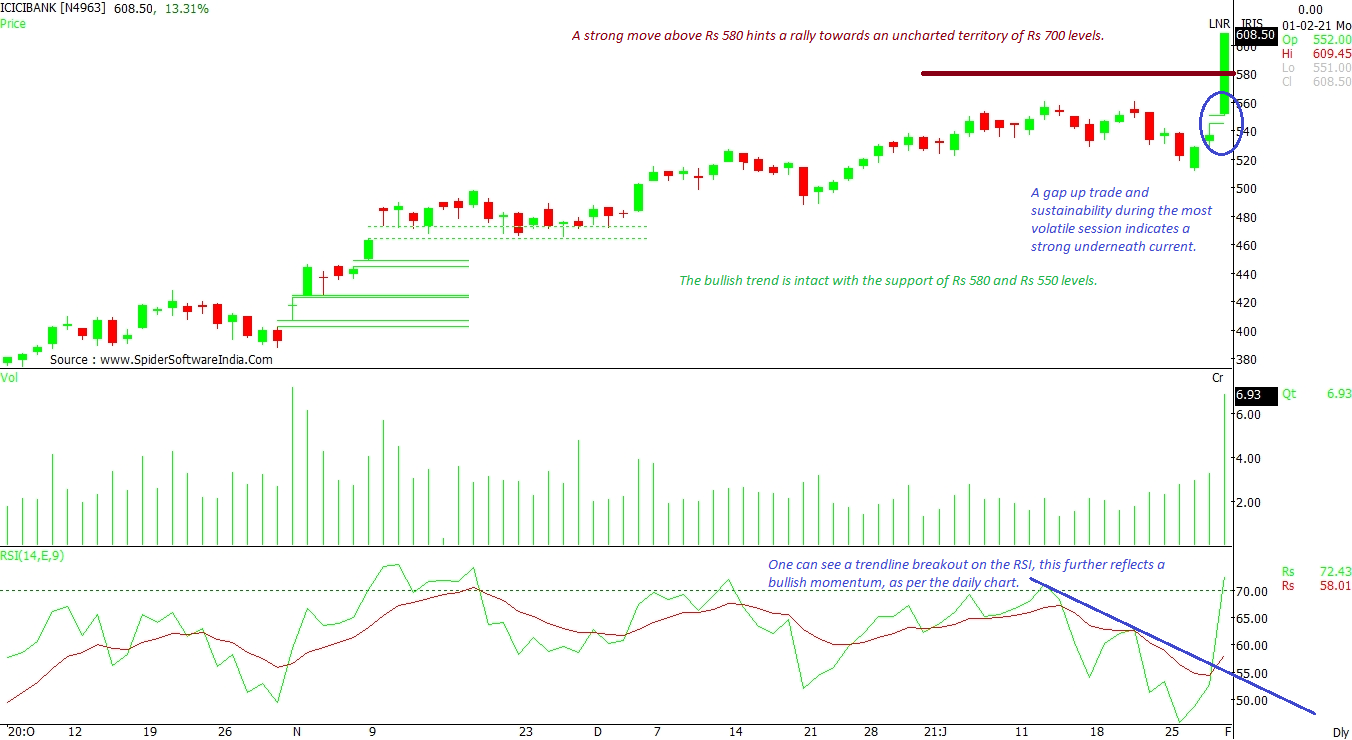
CLICK HERE FOR THE CHART ICICI Bank Ltd (ICICIBANK): A strong move above Rs 580 hints at a rally towards an uncharted territory of Rs 700 levels. A gap-up trade and sustainability during the most volatile session indicate a strong underneath current. One can see a trendline breakout on the RSI, this further reflects a bullish momentum, as per the daily chart. The bullish trend is intact with the support of Rs 580 and Rs 550 levels.
CLICK HERE FOR THE CHART  "Nifty Bank hits fresh high post Budget boost; charts suggest further upside")


