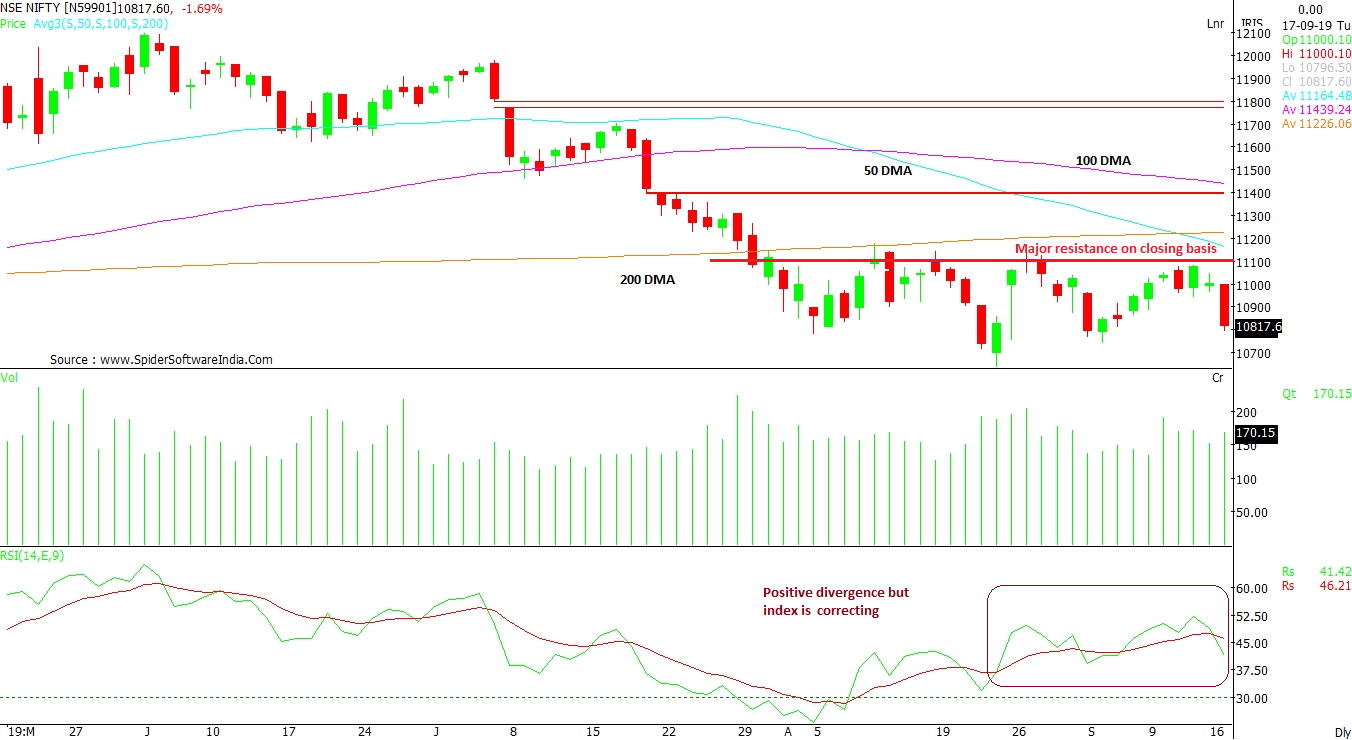
Chart check: Sensex must cross 37,700 level to attract follow-up buying

The S&P BSE Sensex on Tuesday tanked 642 points or 1.73 per cent to end at 36,481.09 while the NSE's Nifty50 settled at 10,818, down 186 points or 1.69 per cent.

Market rally
Breakout above significant levels
Avdhut Bagkar Mumbai
3 min read Last Updated : Sep 18 2019 | 10:17 AM IST
Benchmark indices have taken a heavy beating in the last two sessions amid fears that a spike in crude oil prices following attacks on Saudi oil facilities could hurt the economy further. The S&P BSE Sensex on Tuesday tanked 642 points or 1.73 per cent to end at 36,481.09 while the NSE's Nifty50 settled at 10,818, down 186 points or 1.69 per cent. Amid the sell-off, auto and bank stocks have been the worst hit. 

Here's a look at what technical charts indicate for the key indices

S&P BSE SENSEX: The index needs to cross 37,700 level for the sentiment to turn bullish. It did try to hold above its 200-day moving average (DMA) in August, but failed to hold on to the gains. Global developments and developments back home have made the sentiment weak and a fall towards 36,000 – 36,200 levels cannot be ruled out, as per the daily chart. Also, the 50-DMA has crossed 100-DMA on the downward sloping channel, which is a negative sign. A crossover with 200-DMA may further dampen the sentiment.  CLICK FOR CHART VIEW

NIFTY 50: The 50-DMA dipped below the 200-DMA, forming a “Death Cross” as per the daily chart. This gives a clear indication of a breakdown in the index, if it fails to recover in the coming two sessions. It slipped below 200-DMA on July 30 and has made just one attempt to recover. Thereafter, all the trading sessions witnessed hurdle around 11,100-mark. Secondly, after having positive divergence on the Relative Strength Index (RSI), if the price starts correcting further, then the weakness may continue for few more weeks. There is a support at 10,700 and if the index slips below it, sell-off may intensify. CLICK FOR CHART VIEW

BANKNIFTY:  Since July, the Bank Nifty has traded with “Lower lows, Lower high” formation till the concluding week of August. Then, it recovered taking support at 26,560 level but failed to cross the previous high of 28,602. Thereon, the index is witnessing selling pressure in the range of 28,000 – 28,300 levels and its inability to conquer the mentioned range has dampened the upside sentiment. Now, 27,500 has become a crucial resistance and till the index trades below it,  there is a possibility that it may slide further to the support level of 26,800. CLICK FOR CHART VIEW

NIFTY AUTO: The index retraced below 50-DMA after giving a favourable breakout of a symmetrical formation. Now, the lower rising trend line which falls at 6,820, has become the support level. The positive trend may continue till Moving Average Convergence Divergence (MACD) trades above the zero line. In the coming days, buying may be witnessed in the range of 6,900 – 6,880 levels. CLICK FOR CHART VIEW

One subscription. Two world-class reads.

Already subscribed? Log in

Subscribe to read the full story →
*Subscribe to Business Standard digital and get complimentary access to The New York Times

Smart Quarterly

₹900

3 Months

₹300/Month

SAVE 25%

Smart Essential

₹2,700

1 Year

₹225/Month

SAVE 46%
*Complimentary New York Times access for the 2nd year will be given after 12 months

Super Saver

₹3,900

2 Years

₹162/Month

Subscribe

Renews automatically, cancel anytime

Here’s what’s included in our digital subscription plans

Exclusive premium stories online

  • Over 30 premium stories daily, handpicked by our editors

Complimentary Access to The New York Times

  • News, Games, Cooking, Audio, Wirecutter & The Athletic

Business Standard Epaper

  • Digital replica of our daily newspaper — with options to read, save, and share

Curated Newsletters

  • Insights on markets, finance, politics, tech, and more delivered to your inbox

Market Analysis & Investment Insights

  • In-depth market analysis & insights with access to The Smart Investor

Archives

  • Repository of articles and publications dating back to 1997

Ad-free Reading

  • Uninterrupted reading experience with no advertisements

Seamless Access Across All Devices

  • Access Business Standard across devices — mobile, tablet, or PC, via web or app

Topics :Nifty 50Buzzing stocksNifty Auto indextechnical chartsMarket technicalstechnical analysisChart ReadingMarket forecastNifty Bank indexStock tipsstock market trading

Next Story