Markets have been volatile since the past few sessions with the S&P BSE Sensex giving up the 52,000 levels after a record run since March 2020 low. On the National Stock Exchange (NSE), the Nifty50, too, has been finding it tough to hold on to 15,000 levels.
Is there a reason to panic after the sharp surge in the markets since their March 2020 low? Should you exit? Here's what charts say.
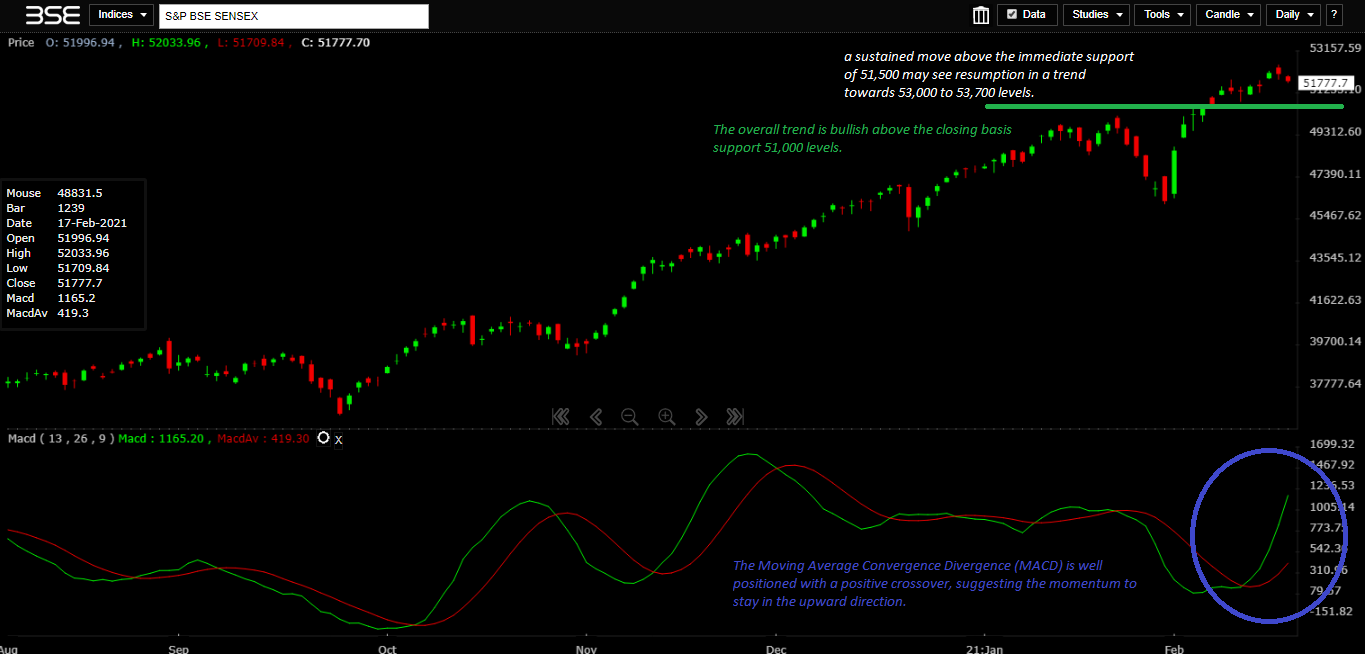
S&P BSE SENSEX: The overall trend remains bullish above the closing basis support 51,000 levels. Going forward, a sustained move above the immediate support of 51,500 may see resumption of the upward trend towards, which can take the index to 53,000 and then 53,700 levels. The Moving Average Convergence Divergence (MACD) is well positioned with a positive crossover, suggesting the momentum is likely to stay positive. CLICK HERE FOR THE CHART
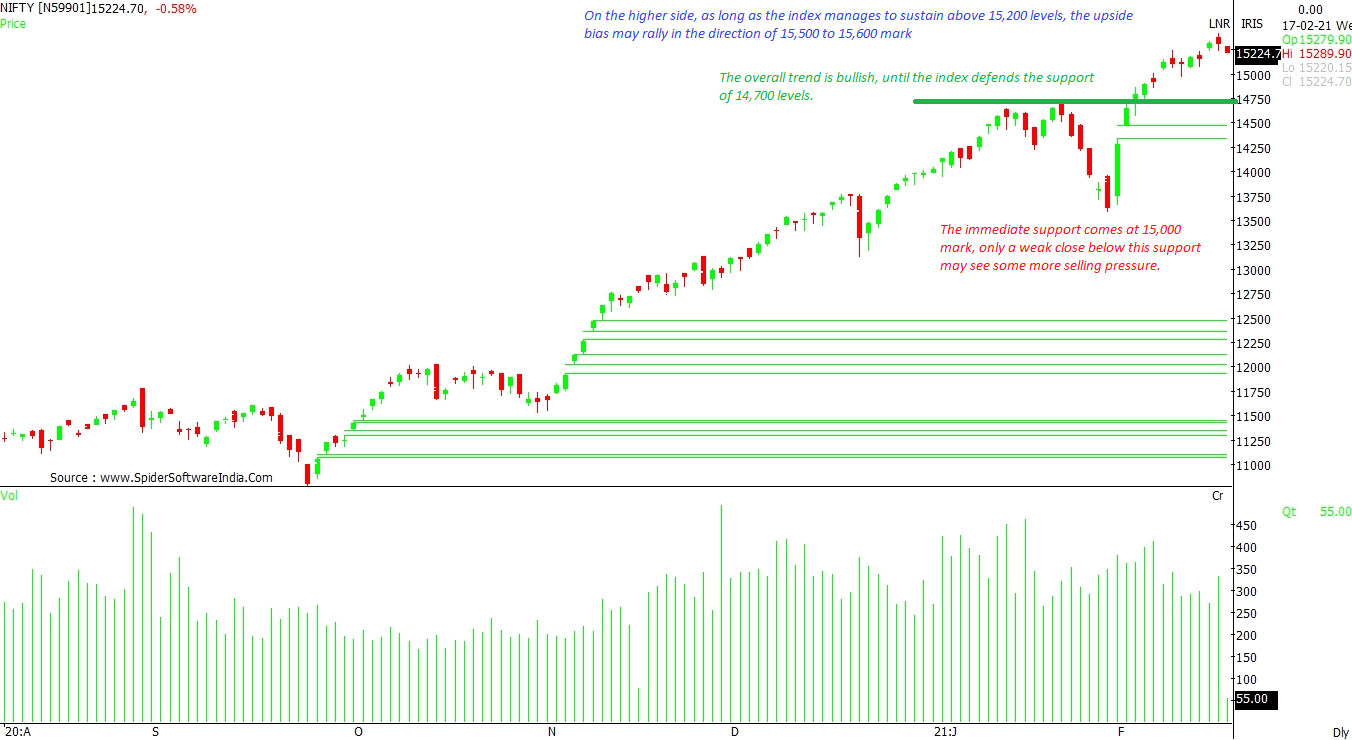
NIFTY50: The overall trend will remain bullish till the index defends the support of 14,700 levels. That said, the immediate support comes in at 15,000 mark and only a weak close below this support may see some more selling pressure. On the higher side, as long as the index manages to sustain above 15,200 levels, the upside bias may see the index move in the direction of 15,500 to 15,600 mark, as per the daily chart. CLICK HERE FOR THE CHART
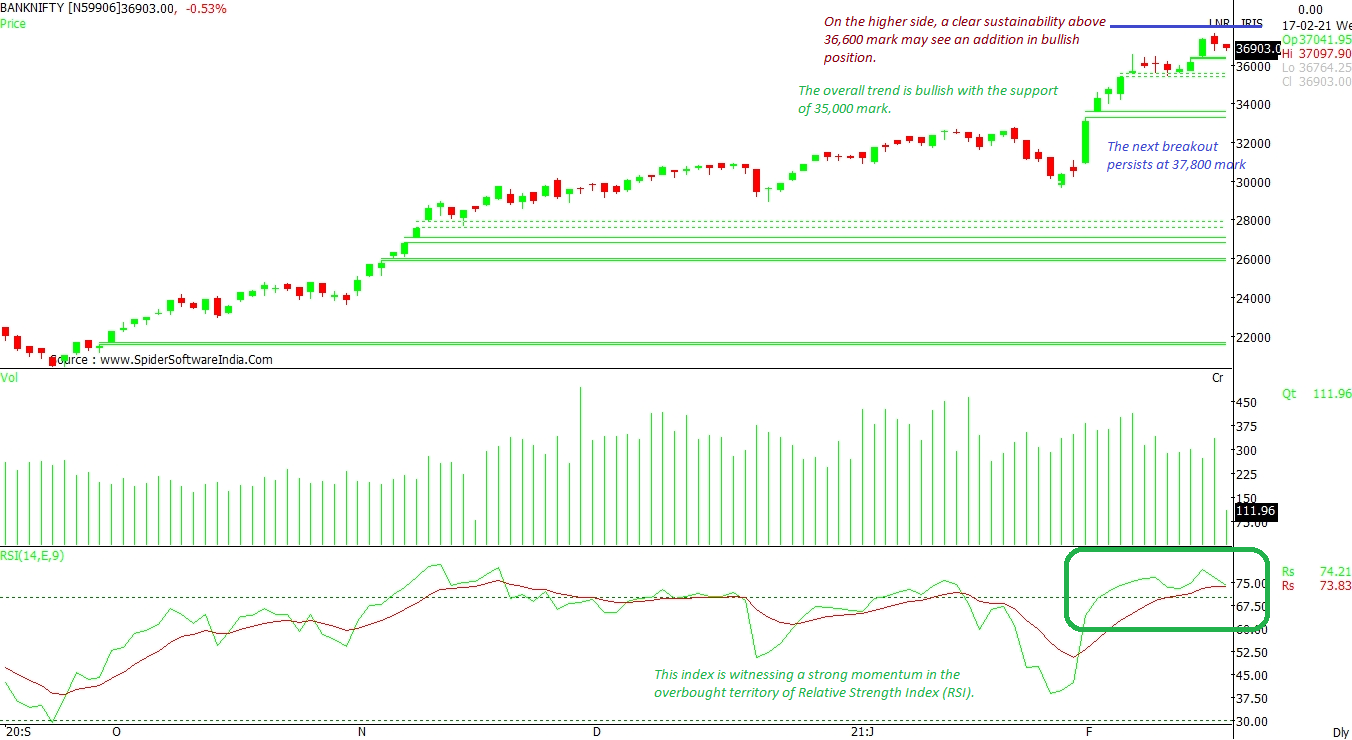
NIFTYBANK: This index is witnessing a strong momentum in the overbought territory of Relative Strength Index (RSI). The overall trend remains bullish with the support of 35,000. On the higher side, a move above 36,600 levels may see more strength. The next breakout then can see the index hit at 37,800 mark, as per the daily chart. CLICK HERE FOR THE CHART
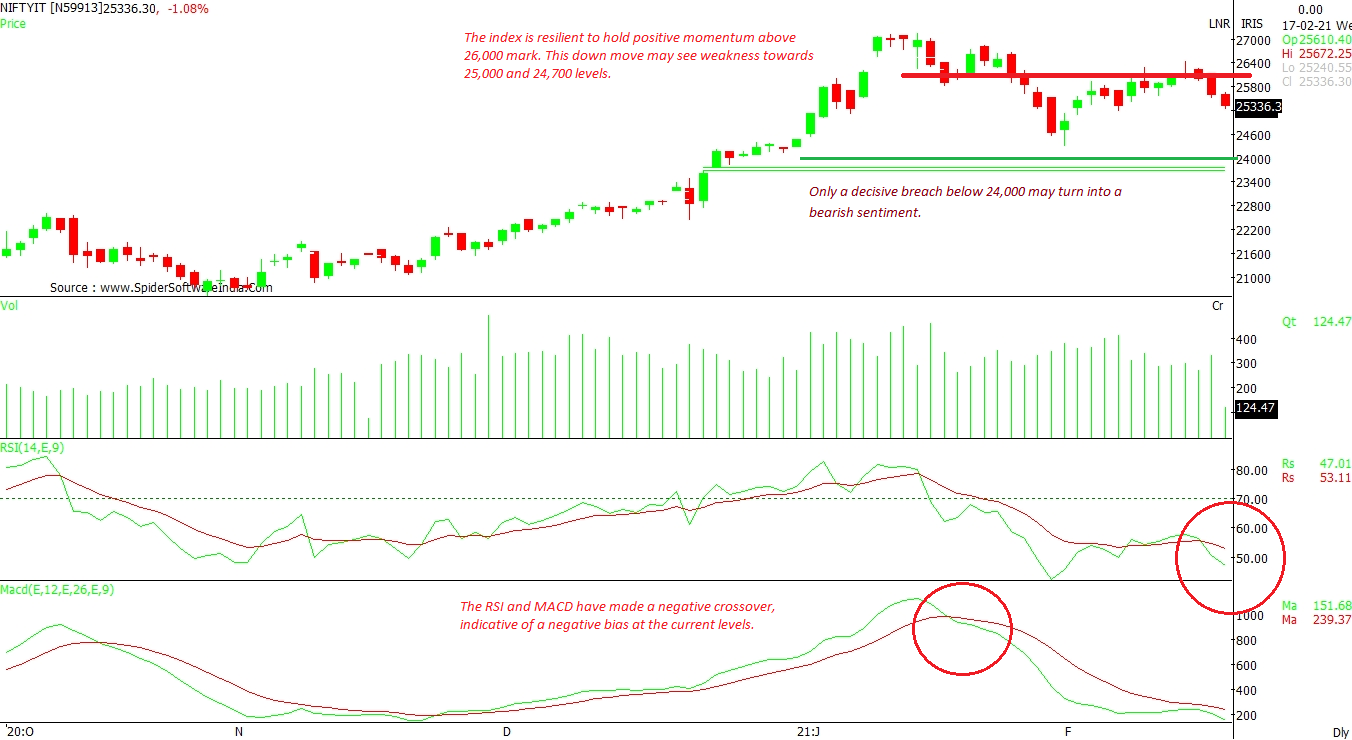
NIFTY IT: The index is finding it tough to hold above 26,000 mark. This weakness may see the index slip towards 25,000 and then 24,700 levels in the days ahead. The RSI and MACD have have made a negative crossover, which is indicative of a negative bias at the current levels. A decisive breach below 24,000 levels may see investors turn aggressively bearish on the index. CLICK HERE FOR THE CHART
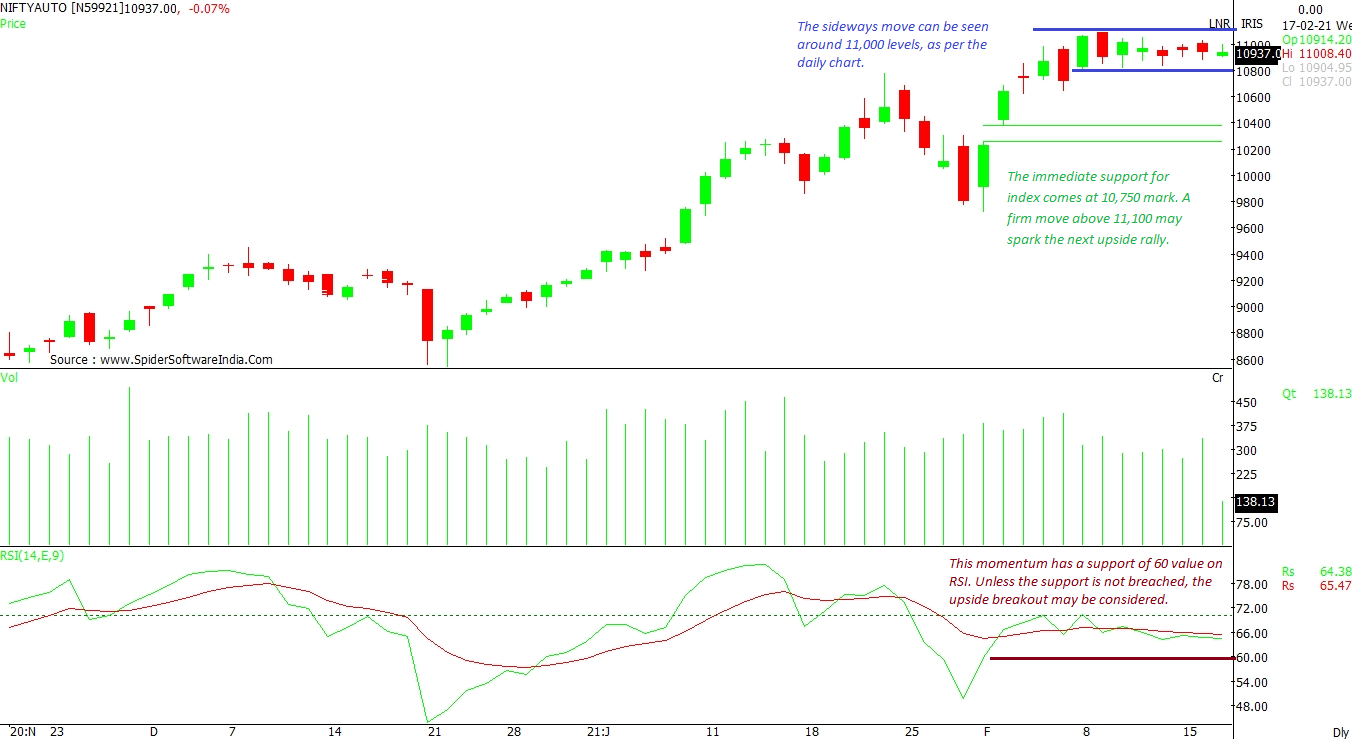
NIFTY AUTO: The index has been moving sideways around the 11,000 levels, as per the daily chart. This momentum has a support of 60 value on RSI. Unless the support is not breached, there are chances that the index may see a breakout on the upside. The immediate support for the index comes in at 10,750. A firm move above 11,100 may trigger an upside rally. CLICK HERE FOR THE CHART
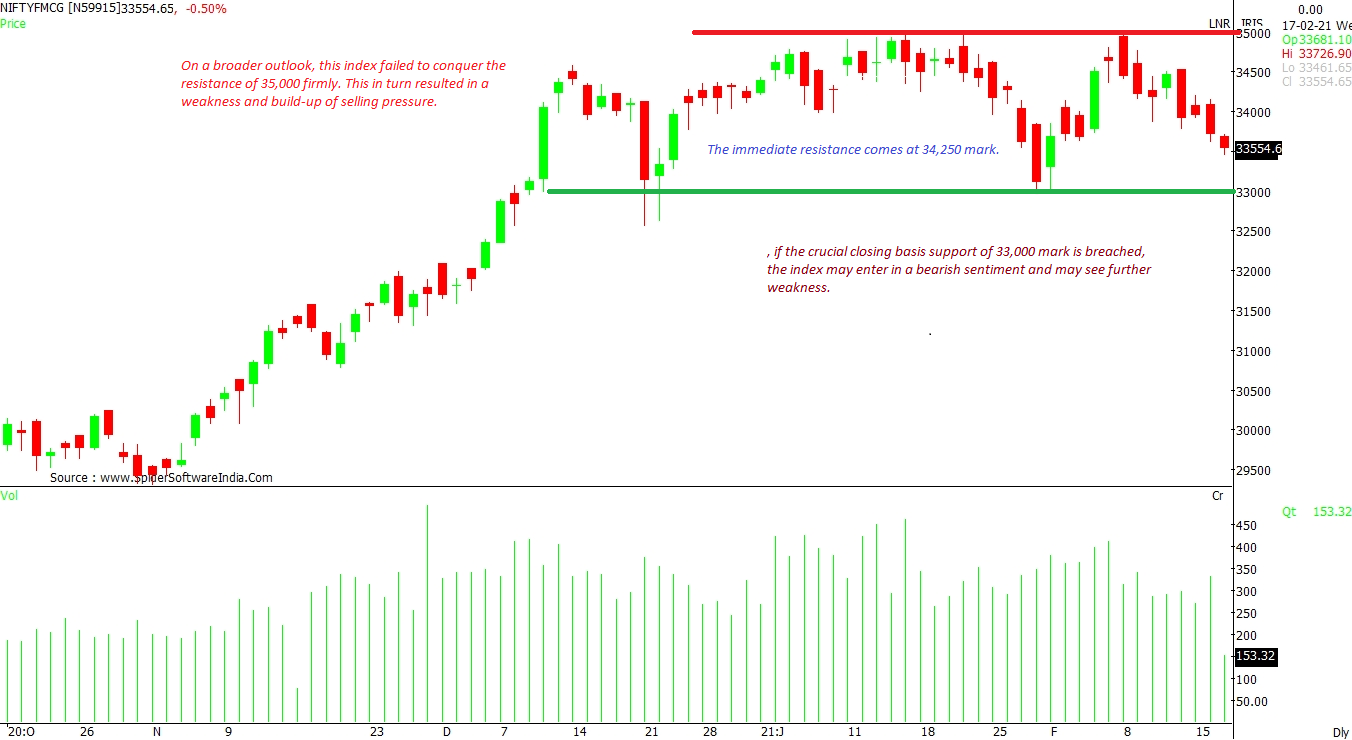
NIFTY FMCG: The index has failed to conquer the resistance of 35,000 firmly. This, in turn, has resulted in weakness and a build-up of selling pressure. Now, if the crucial closing basis support of 33,000 mark is breached, the index may enter a bearish sentiment and may further weaken. The immediate resistance comes at 34,250 leveks. CLICK HERE FOR THE CHART
 "Sensex, Nifty: Don't worry about volatility; crucial supports are intact")


