Technical indicators that can help traders navigate volatility
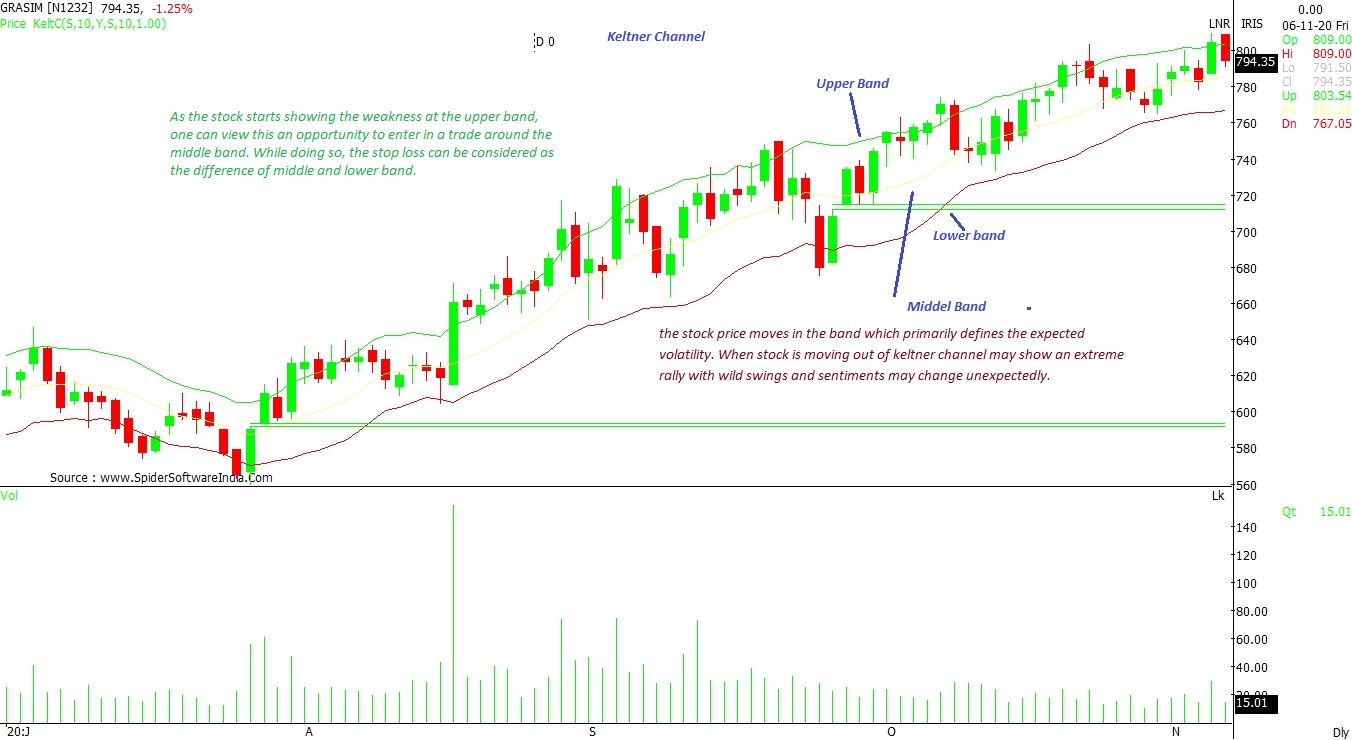
Volatility may trigger stop loss and show certain unexpected moves. Such a scenario disrupts trading morale, leaving traders anxious.
 "Technical indicators that can help traders navigate volatility")
premium
WebinarsNew
Deep DiveNew
Explore Business Standard
Volatility may trigger stop loss and show certain unexpected moves. Such a scenario disrupts trading morale, leaving traders anxious.
Already subscribed? Log in
Subscribe to read the full story →
3 Months
₹300/Month
1 Year
₹225/Month
2 Years
₹162/Month
Renews automatically, cancel anytime

Premium stories handpicked daily by our editors


News, Games, Cooking, Audio, Wirecutter & The Athletic
Digital replica of our daily newspaper — with options to read, save, and share


Insights on markets, finance, politics, tech, and more delivered to your inbox
In-depth market analysis & insights with access to The Smart Investor


Repository of articles and publications dating back to 1997
Uninterrupted reading experience with no advertisements


Access Business Standard across devices — mobile, tablet, or PC, via web or app
First Published: Dec 10 2020 | 8:32 AM IST