Britannia, CDSL, Polyplex among 5 low-risk stocks to add to your portfolio

Data Patterns (India) and Godfrey Phillips are the other two stocks which seem to be favourably placed on the charts, thus making a case for lower-risk at current levels.

Markets, bulls, bears, stocks, trading, technicals, market technical, technical analysis
Rex Cano Mumbai
5 min read Last Updated : Sep 27 2023 | 10:58 AM IST
Indian equity market has entered a phase of uncertainty, off late, mirroring weak cues from the overseas peers as worries over global economic slowdown, higher bonds yields and spurt in crude oil prices weigh on the sentiment.

The S&P BSE benchmark, the Sensex, and the NSE Nifty50 have declined around 3 per cent each from their respective summits at 67,803 and 20,222 in recent trading sessions. 

Presently, the benchmark indices are seen testing support near their key moving averages. The upcoming RBI policy in early October followed by the Q2 earnings season could add to the market volatility. And as such, investors will need to exercise caution while investing in individual shares.

Here are 5 stocks that can potentially gain up to 10 per cent from the current levels, and also seem to be placed in favourably, thus lower-risk, based on the technical chart patterns.

Britannia
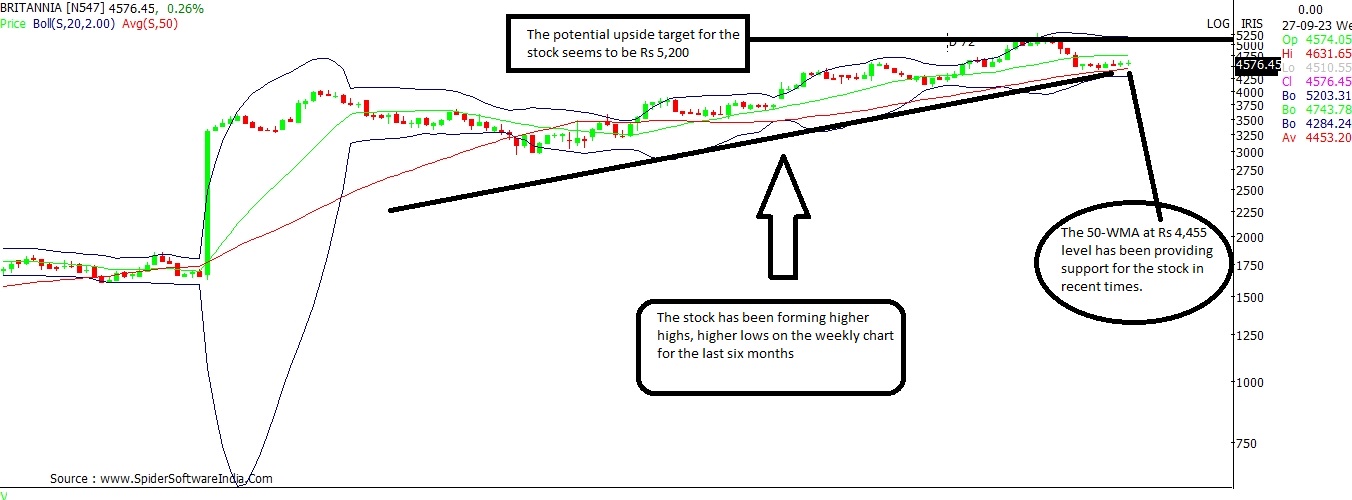
Current Market Price: Rs 4,576
Target: Rs 5,200
Support: Rs 4,455

Shares of Britannia have witnessed a solid rally of over 73 per cent in the last six months. The weekly chart has seen a sustained formation of higher highs, and higher lows during this period.

Amid the recent market weakness, the stock corrected and found support around its 50-WMA (Weekly Moving Average) which now stands at Rs 4,455-odd levels. The stock hit a recent low at Rs 4,426, as against a low of Rs 4,082 in the previous corrective phase. Thus, implying that the stock so far has successfully managed to maintain its trend of higher-highs and higher-lows.

On the upside, the stock may face some resistance around Rs 4,750, which is the 20-WMA, above which Britannia can potentially rally up to Rs 5,200, shows the weekly chart. CLICK HERE FOR THE CHART

CDSL
Current Market Price: Rs 1,340
Targets: Rs 1,430; Rs 1,465
Supports: Rs 1,274; Rs 1,235

CDSL saw aggressive volume-based buying earlier this month, wherein the stock soared as much as 25 per cent in just six trading sessions. Thereafter, the stock witnessed an 11 per cent correction, which was equivalent to the 50 per cent retracement of the previous up move. Thus suggesting, that the recent low of Rs 1,274, should hold for now.

Further, the daily chart suggests the stock has near support at it 20-DMA (Daily Moving Average) at Rs 1,235.

The stock seems to be gearing to resume its up move, with select momentum oscillators like the 14-day RSI (Relative Strength Index) and Slow Stochastic turning positive on the daily charts. On the upside, the stock could target Rs 1,430 followed by Rs 1,465. CLICK HERE FOR THE CHART

Data Patterns (India)
Current Market Price: Rs 2,086
Target: Rs 2,445
Support: Rs 2,035; Rs 1,960
Resistance: Rs 2,150; Rs 2,185

The stock has shown immense resilience in the last two weeks, and traded sideways even as it traded consistently below its short-term moving averages. Key momentum oscillators on the daily chart have now turned favourable for the stock.

The stock needs to clear its immediate hurdles at Rs 2,150 and Rs 2,185, in order to gain upside momentum. As and when the stock conquers its short-term moving averages, it can potentially rally to Rs 2,445 on the upside.

For now, recent lows around Rs 2,035-odd levels seems to be the immediate support, followed by the 100-DMA at Rs 1,960. CLICK HERE FOR THE CHART

Godfrey Phillips
Current Market Price: Rs 2,076
Target: Rs 2,340
Support: Rs 2,090; Rs 2,025
Resistance: Rs 2,180

In late August, Godfrey Phillips saw a strong breakout on the daily charts from its earlier trading range, post which the stock hit a high of Rs 2,245 and has since consolidated. 

The key momentum oscillators on the daily chart have turned favourable for the stock, thus suggesting that a sharp up move may just be round the corner. 

For now, the stock seems to have bounced back after testing support at the lower-end of the Bollinger Bands on the daily chart. The 20-DMA at Rs 2,090 followed by the 50-DMA at Rs 2,025 are likely to act as strong supports in the near term.

On the upside, break and sustained trade above Rs 2,180, can trigger a rally to Rs 2,340. CLICK HERE FOR THE CHART

Polyplex Corporation
Current Market Price: Rs 1,189
Target: Rs 1,390; Rs 1,470
Support: Rs 1,178

Contrary to other stocks, Polyplex Corporation can be a good counter bet as the stock has witnessed a sharp 59 per cent decline from its peak level of Rs 2,705 in mid-April 2022. 

Barring that, for the last seven weeks the stock seems to be forming a base around its 200-WMA which stands at Rs 1,178. Select momentum oscillators like RSI and MACD (Moving Average Convergence-Divergence) have turned favourable on the weekly charts.

Thus, a relief or counter rally from present levels could trigger an upside up to Rs 1,390 or even higher to Rs 1,470 in the short-term. CLICK HERE FOR THE CHART
 

One subscription. Two world-class reads.

Already subscribed? Log in

Subscribe to read the full story →
*Subscribe to Business Standard digital and get complimentary access to The New York Times

Smart Quarterly

₹900

3 Months

₹300/Month

SAVE 25%

Smart Essential

₹2,700

1 Year

₹225/Month

SAVE 46%
*Complimentary New York Times access for the 2nd year will be given after 12 months

Super Saver

₹3,900

2 Years

₹162/Month

Subscribe

Renews automatically, cancel anytime

Here’s what’s included in our digital subscription plans

Exclusive premium stories online

  • Over 30 premium stories daily, handpicked by our editors

Complimentary Access to The New York Times

  • News, Games, Cooking, Audio, Wirecutter & The Athletic

Business Standard Epaper

  • Digital replica of our daily newspaper — with options to read, save, and share

Curated Newsletters

  • Insights on markets, finance, politics, tech, and more delivered to your inbox

Market Analysis & Investment Insights

  • In-depth market analysis & insights with access to The Smart Investor

Archives

  • Repository of articles and publications dating back to 1997

Ad-free Reading

  • Uninterrupted reading experience with no advertisements

Seamless Access Across All Devices

  • Access Business Standard across devices — mobile, tablet, or PC, via web or app

Topics :Market technicalsMarket trendsTrading strategiesstock market tradingstocks technical analysistechnical chartsStocks to buyCDSLBritanniaPolyplex CorporationGodfrey PhillipsData Patterns

Next Story