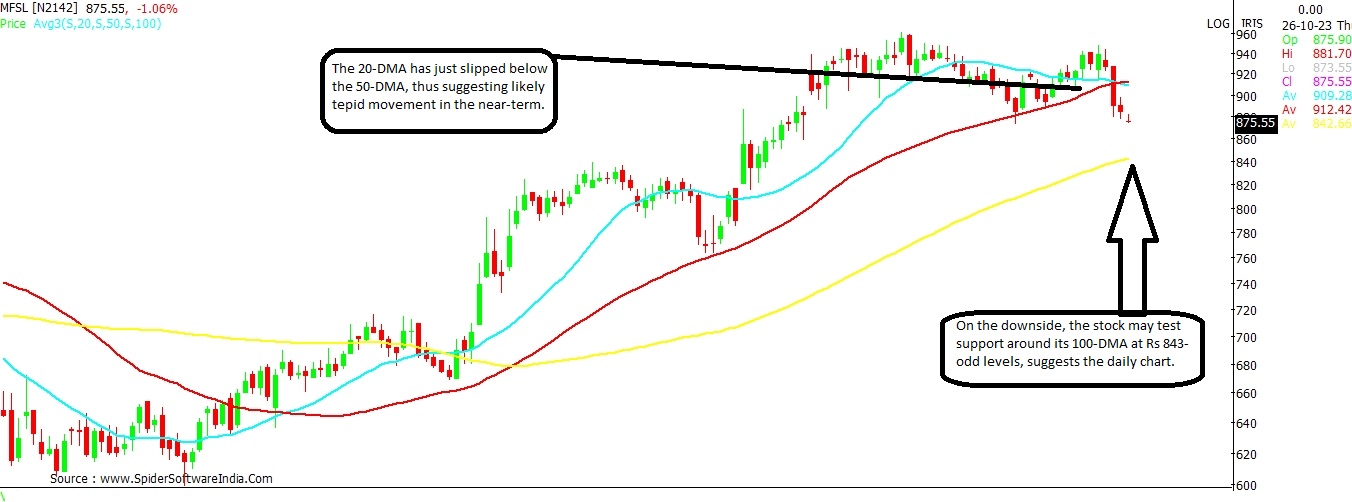
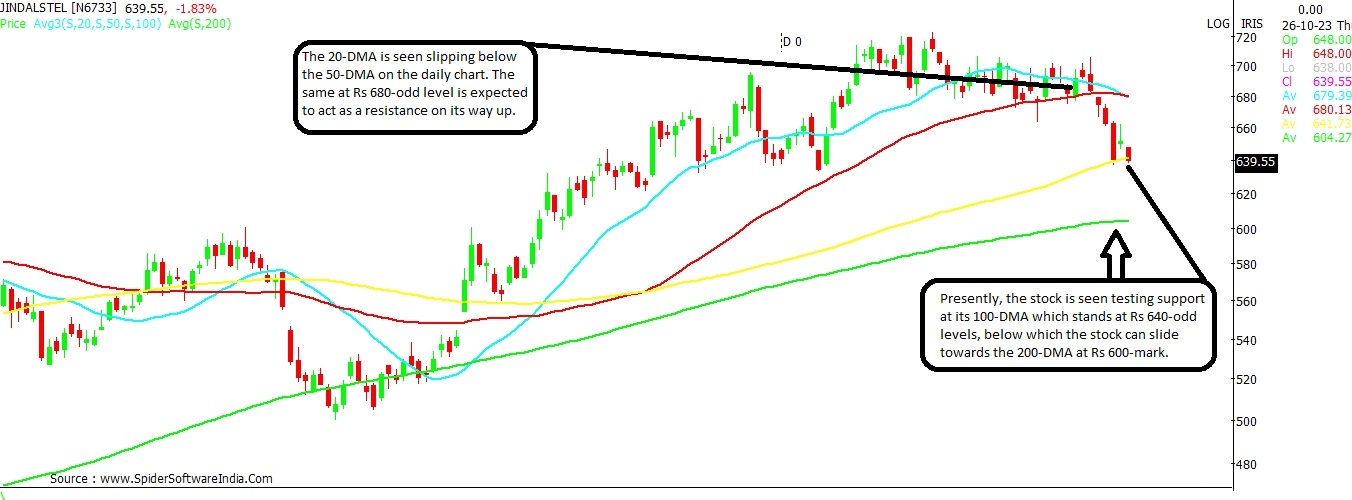
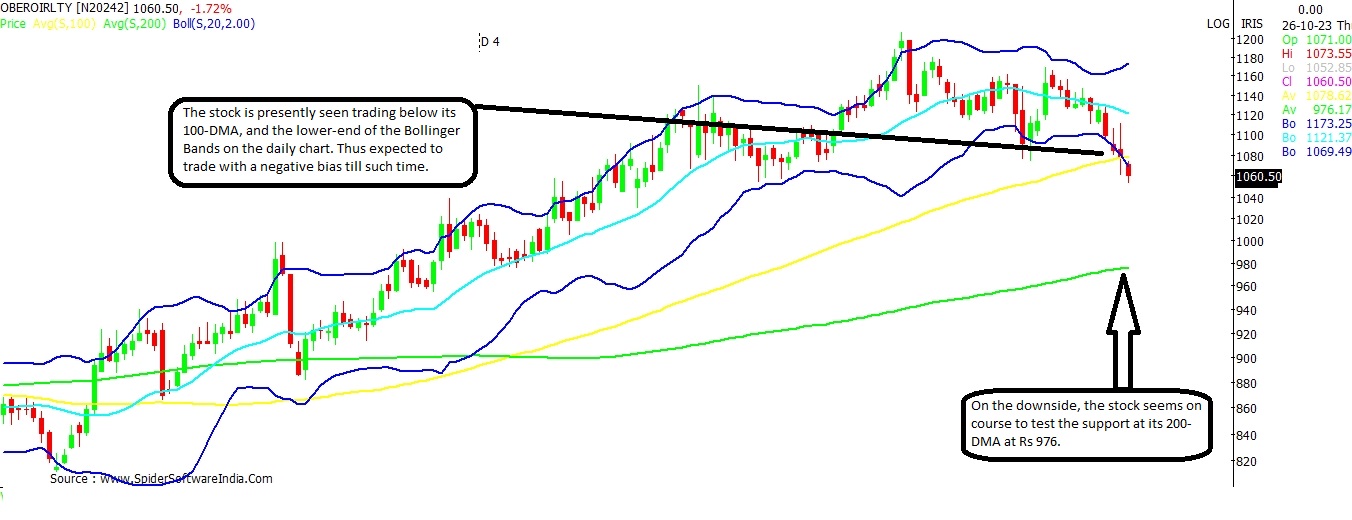
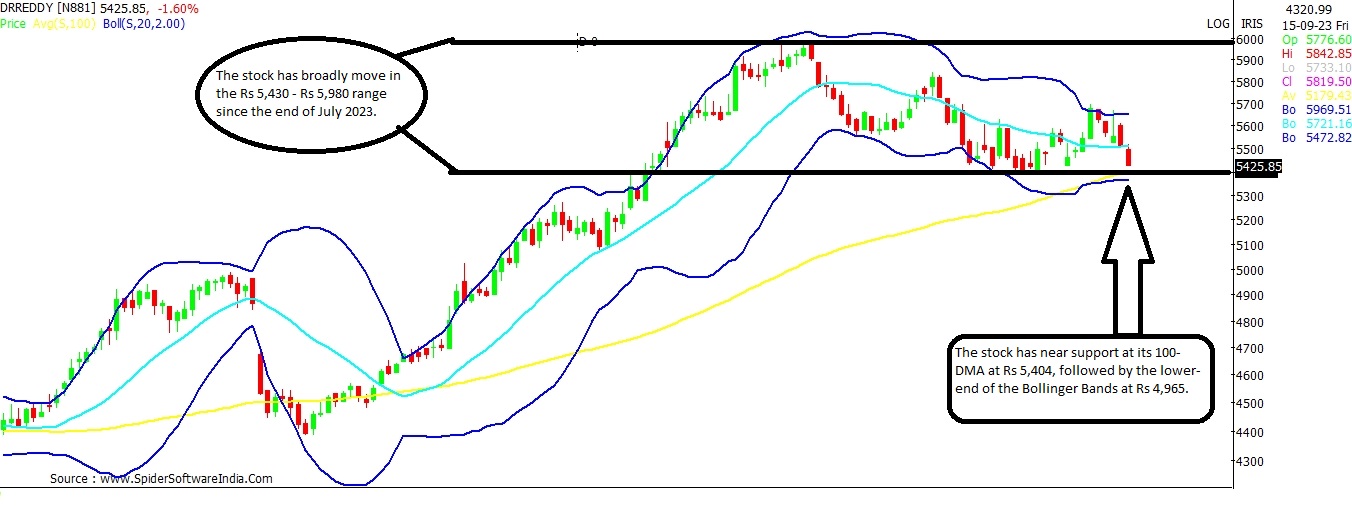
Max Fin, JSP, Oberoi: Strategy for stocks with highest F&O rollover to Nov
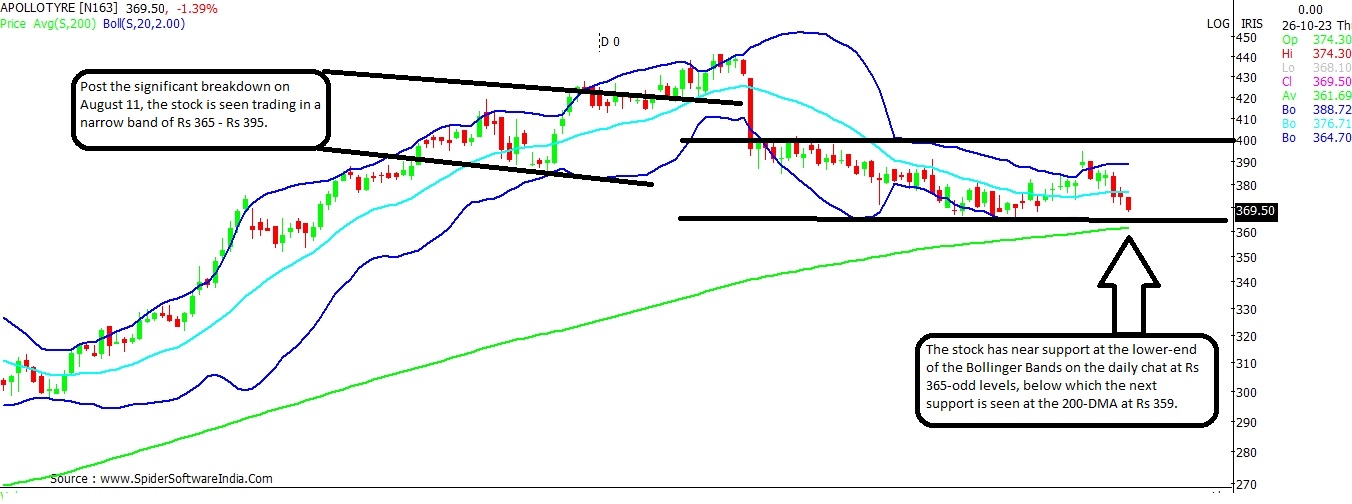
Dr.Reddy's, Apollo Tyres and Jindal Steel are among the five stocks which have seen rollovers of up to 88 per cent to the November series.
 "Max Fin, JSP, Oberoi: Strategy for stocks with highest F&O rollover to Nov")
premium
Explore Business Standard
Dr.Reddy's, Apollo Tyres and Jindal Steel are among the five stocks which have seen rollovers of up to 88 per cent to the November series.
Already subscribed? Log in
Subscribe to read the full story →
3 Months
₹300/Month
1 Year
₹225/Month
2 Years
₹162/Month
Renews automatically, cancel anytime

Over 30 premium stories daily, handpicked by our editors


News, Games, Cooking, Audio, Wirecutter & The Athletic
Digital replica of our daily newspaper — with options to read, save, and share


Insights on markets, finance, politics, tech, and more delivered to your inbox
In-depth market analysis & insights with access to The Smart Investor


Repository of articles and publications dating back to 1997
Uninterrupted reading experience with no advertisements


Access Business Standard across devices — mobile, tablet, or PC, via web or app
First Published: Oct 26 2023 | 11:13 AM IST