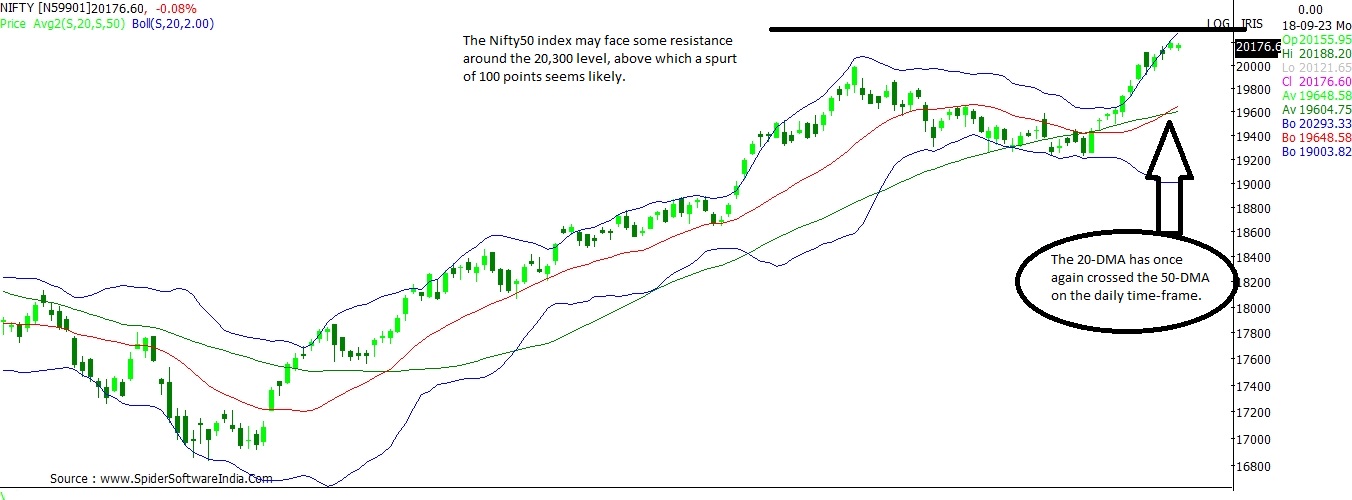
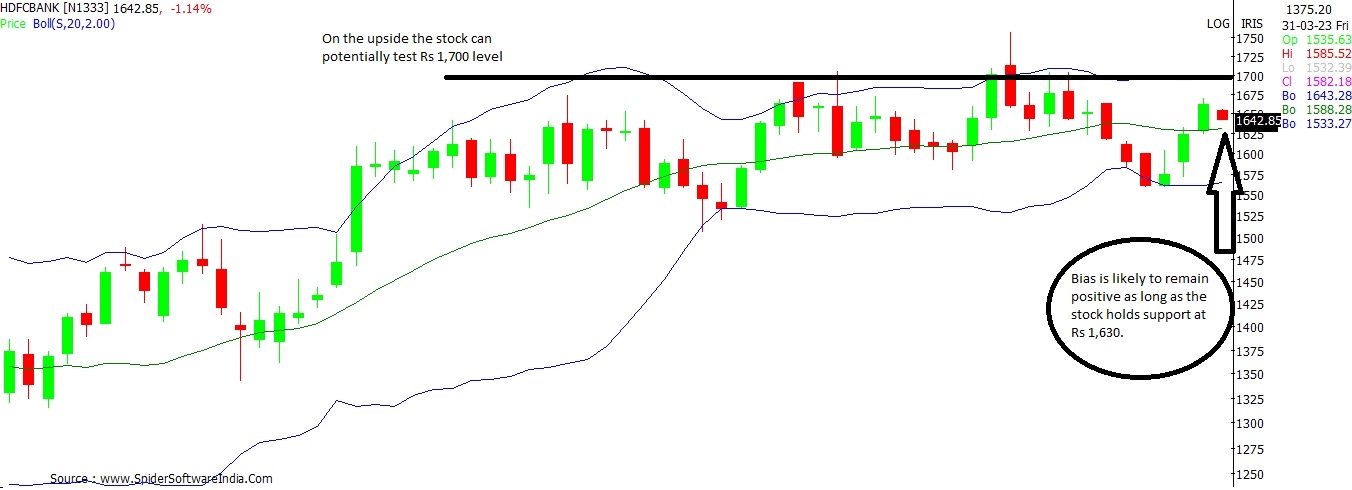
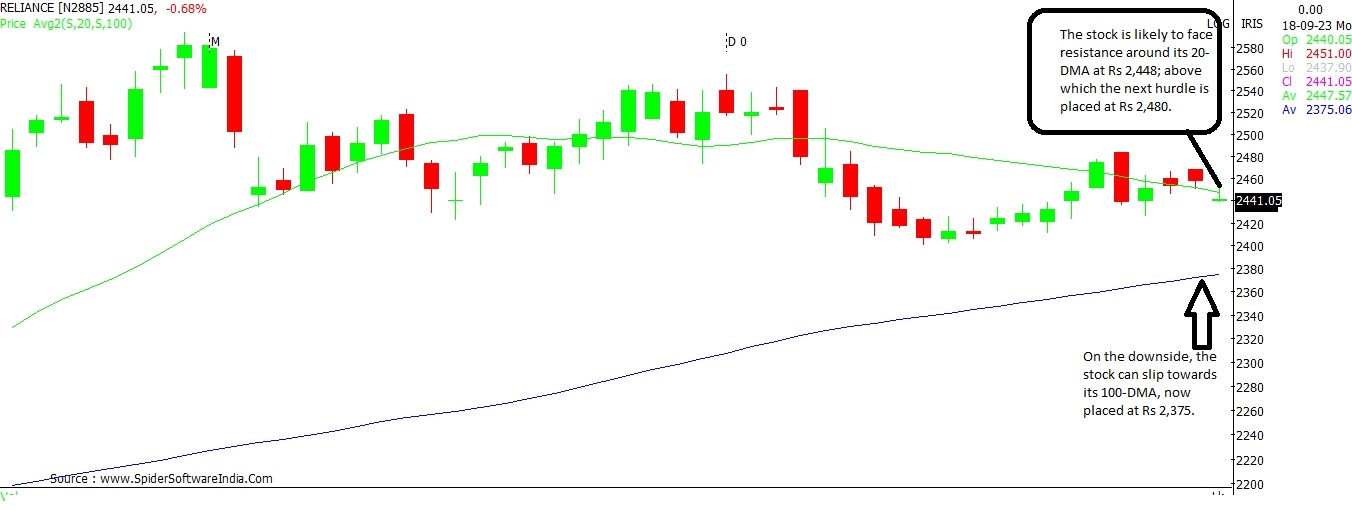
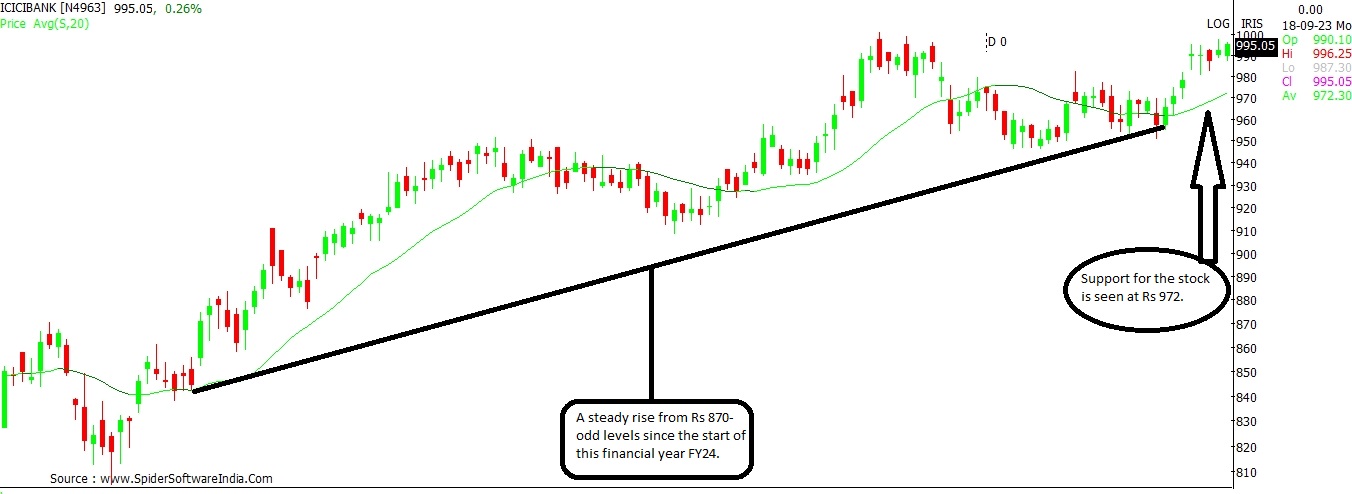
Nifty heavyweights at crossroads; HDFC, ICICI Bank look favourable on chart

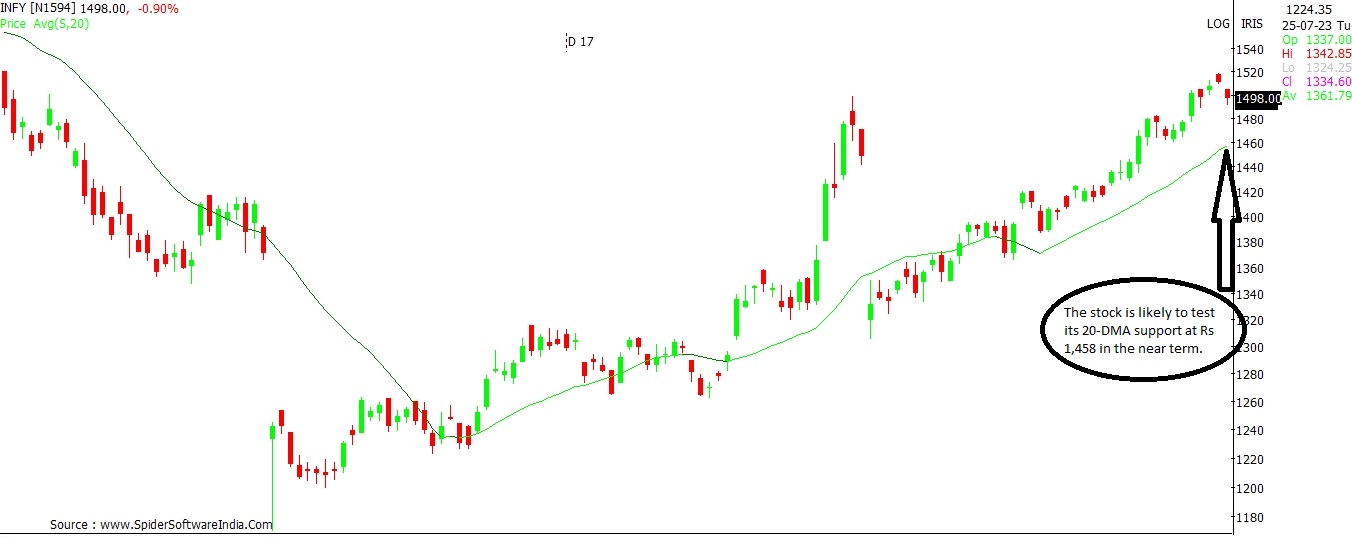
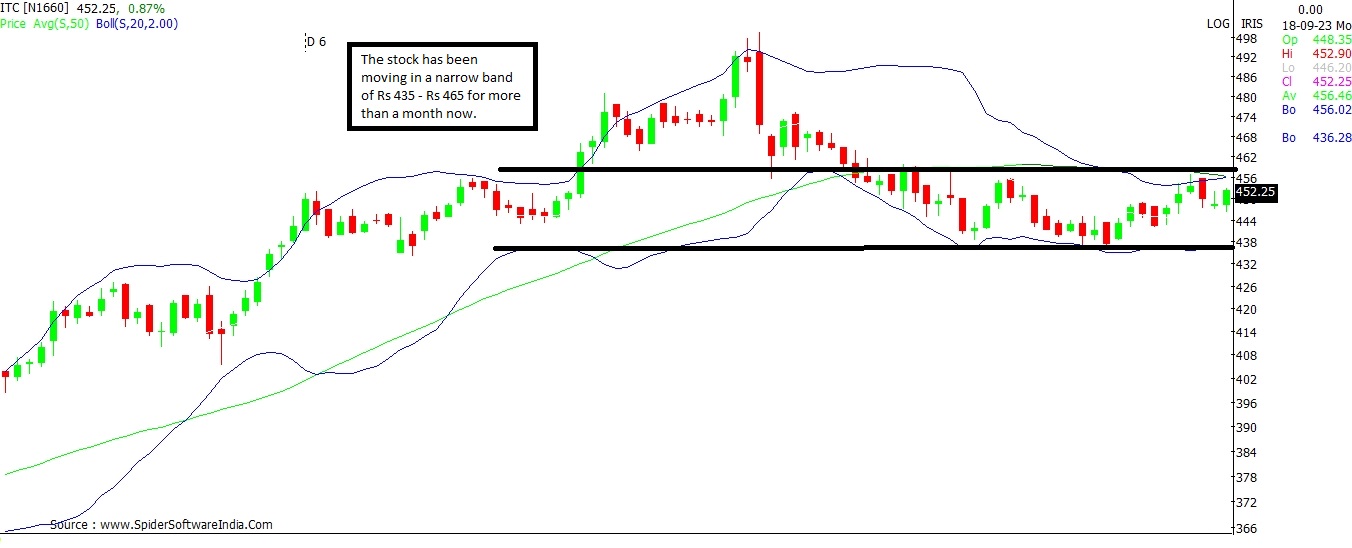
HDFC Bank, Reliance Industries, ICICI Bank, Infosys and ITC collectively hold over 42 per cent weightage on the Nifty 50, and are expected to act as trend setters for the benchmark.

markets, stocks, stock call, buy, sell, trading ideas, buy sell ideas
Rex Cano Mumbai
4 min read Last Updated : Sep 18 2023 | 12:14 PM IST
Indian equity market have witnessed a sharp rally in the last two weeks in spite of worries of slowdown in global economies, mainly the US and China, and lingering fears of a longer-than-anticipated regime of higher interest rates.

Now that the benchmark indices, the Sensex and the Nifty, have scaled new life-time summits and the buzz on the street is that the market may witness some consolidation going ahead. And as such, the outcome on interest rates decision by the US Federal Reserve on Wednesday might just act as a trigger.

The Nifty50 has rallied over 900 points in the last 11 straight trading sessions. Whichever direction the index takes in the near-term these 5 index heavyweights are expected to play a detrimental role, as the collectively account for 42.1 per cent weightage on the NSE benchmark index.

Nifty 
Outlook: Positive; Near resistance seen at 20,300

The overall chart structure for the Nifty50 index looks promising, with the 20-DMA (Daily Moving Average) at 19,650, now once again edging past the 50-DMA at 19,605. The near-term bias is likely to remain bullish as long as the index holds above the 20,000-mark. On the upside, the index may face some resistance around 20,300, above which a spurt to 20,400 seems likely. CLICK HERE FOR THE CHART

HDFC Bank
Outlook: Bias positive above Rs 1,630

HDFC Bank at 14.1 per cent has the maximum weightage among the Nifty50 stocks. Any strong directional move in the stock is likely to bear a significant impact on the underlying index. 

Shares of HDFC Bank have recently conquered the 50- and 100-DMA after a gap of nearly one month. The short-term (20-DMA) is at Rs 1,602, however, is well below the other key moving averages. Further, select momentum oscillators on the daily chart have turned negative. Having said that, the weekly chart structure looks more re-assuring, with the bias likely to remain positive as long as the stock trades above Rs 1,630. On the upside, the stock is likely to hit Rs 1,700 level. CLICK HERE FOR THE CHART

Reliance Industries 
Outlook: Marginally Negative

Reliance has underperformed in the recent market rally, and is now seen struggling around its 20-DMA at Rs 2,448. Select momentum oscillators, both, on the daily and the weekly chart too have turned negative for the stock. Hence, the stock may witness some downward pressure with resistance around Rs 2,448 and Rs 2,480. On the downside, the stock can slip towards its 100-DMA at Rs 2,375. CLICK HERE FOR THE CHART

ICICI Bank
Outlook: Fresh upside only above Rs 998

ICICI Bank has been trading with a positive bias since the start of the current financial year and has seen a steady rise of over 14 per cent in FY24. While, the bias seems favourable for the stock, it needs to break and sustain above Rs 998 on a consistent basis for further up move to emerge. On the upside, the stock can spurt to Rs 1,045-odd levels. Whereas, on the downside, the stock is likely to get considerable support around Rs 972. CLICK HERE FOR THE CHART

Infosys
Outlook: May test Rs 1,458 in the near-term 

Select momentum oscillators, namely, the 14-day RSI (Relative Strength Index) and the Slow Stochastic have seen negative crossover on the daily chart. Even though, the broader trend remains positive, the stock may test its 20-DMA on the downside at Rs 1,458.  On the upside, the Rs 1,500-1,525 band seems to be a stiff challenge for the stock as of now. CLICK HERE FOR THE CHART

ITC
Outlook: Awaiting breakout

Shares of ITC are seen moving in a narrow trading band of Rs 435 - Rs 460 for more than a month now. The upside seem capped around its 50-DMA at Rs 460, whereas on the downside, the lower-end of the Bollinger Band is seen supportive buying. Momentum oscillators on the weekly chart are mostly favourable. Hence, as and when the stock breaks above Rs 460, it is likely to rally towards Rs 485. CLICK HERE FOR THE CHART

Conclusion: The Nifty may be able to hold the positive bias as private banking majors - HDFC Bank and ICICI Bank, with a combined weightage of 22.1 per cent on the index, look positive on the charts. On the other, Reliance and Infosys, with a combined weightage of 15.3 per cent look a bit tepid for now and may act as spoilsports; whereas ITC lacks direction.
 

One subscription. Two world-class reads.

Already subscribed? Log in

Subscribe to read the full story →
*Subscribe to Business Standard digital and get complimentary access to The New York Times

Smart Quarterly

₹900

3 Months

₹300/Month

SAVE 25%

Smart Essential

₹2,700

1 Year

₹225/Month

SAVE 46%
*Complimentary New York Times access for the 2nd year will be given after 12 months

Super Saver

₹3,900

2 Years

₹162/Month

Subscribe

Renews automatically, cancel anytime

Here’s what’s included in our digital subscription plans

Exclusive premium stories online

  • Over 30 premium stories daily, handpicked by our editors

Complimentary Access to The New York Times

  • News, Games, Cooking, Audio, Wirecutter & The Athletic

Business Standard Epaper

  • Digital replica of our daily newspaper — with options to read, save, and share

Curated Newsletters

  • Insights on markets, finance, politics, tech, and more delivered to your inbox

Market Analysis & Investment Insights

  • In-depth market analysis & insights with access to The Smart Investor

Archives

  • Repository of articles and publications dating back to 1997

Ad-free Reading

  • Uninterrupted reading experience with no advertisements

Seamless Access Across All Devices

  • Access Business Standard across devices — mobile, tablet, or PC, via web or app

Topics :Market technicalsTrading strategiesNifty OutlookMarket OutlookReliance IndustriesHDFC BankICICI Bank Infosys ITC Ltdstocks technical analysistechnical charts

Next Story