Statsguru: Households with smaller landholdings earn more from wage labour
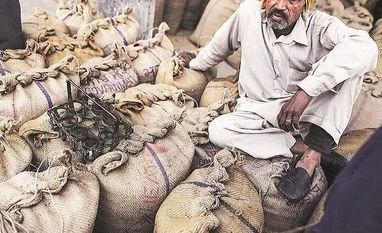
On indebtedness, the survey data shows that more than half of agricultural households were indebted with bulk of the credit flowing from non-institutional sources
 "Statsguru: Households with smaller landholdings earn more from wage labour")
premium
Explore Business Standard
Associate Sponsors
Co-sponsor
On indebtedness, the survey data shows that more than half of agricultural households were indebted with bulk of the credit flowing from non-institutional sources
Already subscribed? Log in
Subscribe to read the full story →
3 Months
₹300/Month
1 Year
₹225/Month
2 Years
₹162/Month
Renews automatically, cancel anytime

Over 30 premium stories daily, handpicked by our editors


News, Games, Cooking, Audio, Wirecutter & The Athletic
Digital replica of our daily newspaper — with options to read, save, and share


Insights on markets, finance, politics, tech, and more delivered to your inbox
In-depth market analysis & insights with access to The Smart Investor


Repository of articles and publications dating back to 1997
Uninterrupted reading experience with no advertisements


Access Business Standard across devices — mobile, tablet, or PC, via web or app
First Published: Aug 27 2018 | 12:13 AM IST
