Statsguru: India's health chart
While air pollution has moved up, metabolic risks, e.g. high blood pressure, have rapidly jumped up the ladder
 "Statsguru: India's health chart")
premium
WebinarsNew
Explore Business Standard
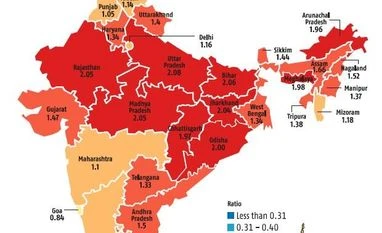
While air pollution has moved up, metabolic risks, e.g. high blood pressure, have rapidly jumped up the ladder
StatsGuru is a weekly feature. Every Monday, Business Standard guides you through the numbers you need to know to make sense of the headlines. Source: India: Health of Nation’s States, a report by the Indian Council of Medical Research, Public Health Foundation of India, and the Indian Institute of Health Metrics and Evaluation; Compiled by BS Research Bureau
Already subscribed? Log in
Subscribe to read the full story →
3 Months
₹300/Month
1 Year
₹225/Month
2 Years
₹162/Month
Renews automatically, cancel anytime

Over 30 premium stories daily, handpicked by our editors


News, Games, Cooking, Audio, Wirecutter & The Athletic
Digital replica of our daily newspaper — with options to read, save, and share


Insights on markets, finance, politics, tech, and more delivered to your inbox
In-depth market analysis & insights with access to The Smart Investor


Repository of articles and publications dating back to 1997
Uninterrupted reading experience with no advertisements


Access Business Standard across devices — mobile, tablet, or PC, via web or app
First Published: Nov 27 2017 | 1:12 AM IST