All you need to know about Commodity Channel Index in trading
The basic philosophy of CCI is based on the assumption that commodities, stocks and bonds trade in a cycle with a peak and a trough arrived at on a periodic basis.
 "All you need to know about Commodity Channel Index in trading")
premium
WebinarsNew
Deep DiveNew
Explore Business Standard
The basic philosophy of CCI is based on the assumption that commodities, stocks and bonds trade in a cycle with a peak and a trough arrived at on a periodic basis.
The Commodity Channel Index (CCI) was developed to identify cyclical trends in commodities. Over the years, though, the CCI indicator has been successfully used in gauging the outlook of other instruments like securities and bonds. The focus of CCI is to determine the reversal levels and identify the overbought and oversold conditions.
The CCI compares the current price to the simple moving average over a given period of time, which is reflected in percentage terms. The percentage may exceed over 100 per cent and can even fall below -100 per cent. The basic philosophy of CCI is based on the assumption that commodities, stocks and bonds trade in a cycle with a peak and a trough arrived at on a periodic basis.
How to trade CCI indicator?
Whenever the CCI indicator crosses above 100 per cent, the signal triggers a bullish outlook. Herein, the positive bias remains intact, till the indicator does not fall below -100 per cent. Also, the zero line is looked upon as the immediate support level. If the stock shows reversal after taking support of the zero line, the indicator may see addition of longs or averaging bullish trade.
Similarly, a stock falling below -100 per cent is considered as bearish and a shorting candidate. The overall sentiment is viewed as negative and the security is expected to decline further.
The other way of considering the CCI indicator is on the overbought and oversold condition. Theoretically, a stock rising above 100 per cent is known as overbought and below -100 per cent as oversold. Entering a trade in an overbought/oversold condition may result in unexpected risks and returns.
This indicator is quite similar to the Relative Strength Index (RSI) and prefers divergence and trendline breakout. A positive divergence occurs when the indicator moves back above -100 and vice versa. A trendline breakout may also suggest a sharp rally in the upcoming sessions.
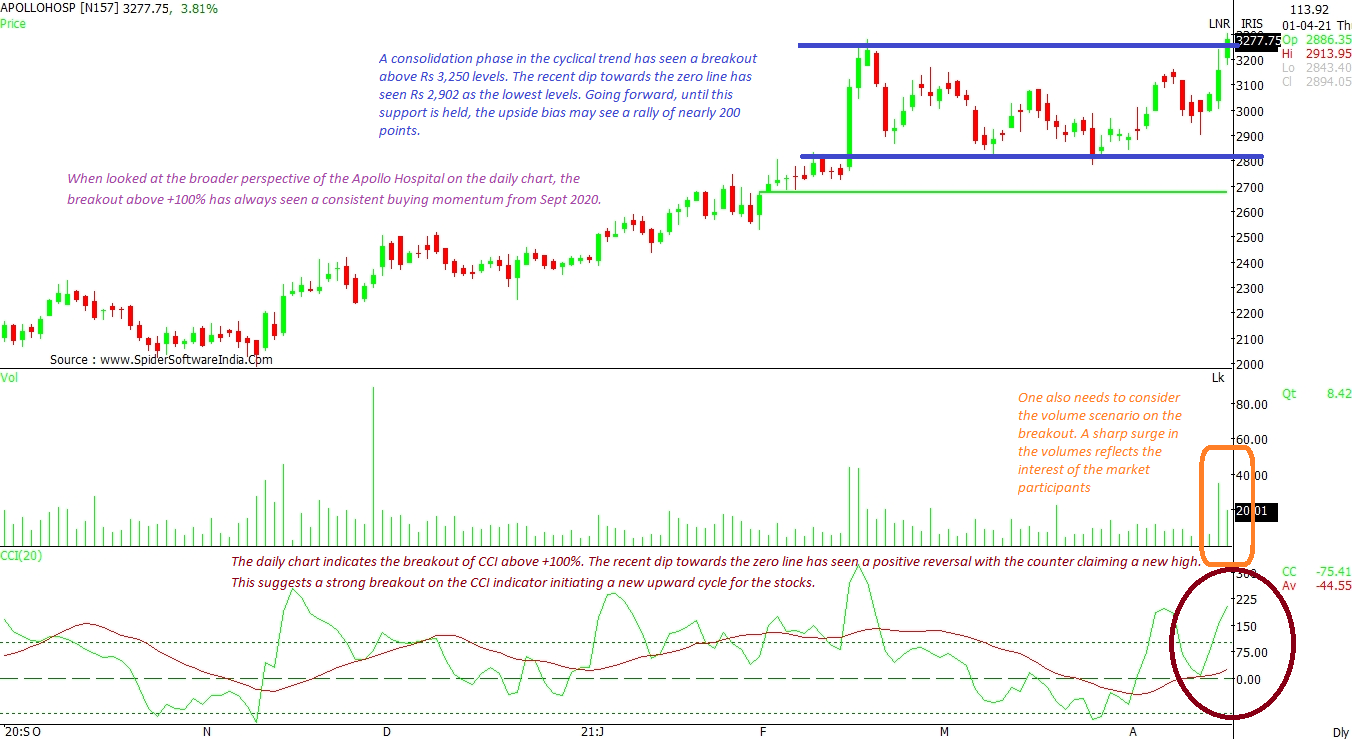
Let’s consider the chart of Apollo Hospitals Enterprise Ltd
The daily chart indicates the breakout of CCI above +100 per cent. The recent dip towards the zero line has seen a positive reversal with the counter claiming a new high. This suggests a strong breakout on the CCI indicator initiating a new upward cycle for the stock.
One also needs to consider the volume scenario on the breakout. A sharp surge in the volumes reflects the interest of market participants. And if the similar scenario continues to persist for a few more sessions, then follow-up buying may cause a strong upside in this counter.
A consolidation phase in the cyclical trend has seen a breakout above Rs 3,250 levels. The recent dip towards the zero line has seen Rs 2,902 as the lowest levels. Going forward, until this support is held, the upside bias may see a rally of nearly 200 points. The weekly chart indicates the closing basis support of Rs 3,000 levels on CCI indicator.
When Apollo Hospital's daily chart is looked at from the broader perspective, the breakout above +100 per cent has always seen consistent buying momentum since September 2020.
Already subscribed? Log in
Subscribe to read the full story →
3 Months
₹300/Month
1 Year
₹225/Month
2 Years
₹162/Month
Renews automatically, cancel anytime

Over 30 premium stories daily, handpicked by our editors


News, Games, Cooking, Audio, Wirecutter & The Athletic
Digital replica of our daily newspaper — with options to read, save, and share


Insights on markets, finance, politics, tech, and more delivered to your inbox
In-depth market analysis & insights with access to The Smart Investor


Repository of articles and publications dating back to 1997
Uninterrupted reading experience with no advertisements


Access Business Standard across devices — mobile, tablet, or PC, via web or app
First Published: May 04 2021 | 8:27 AM IST