All you wanted to know about the Average Directional Index in trading
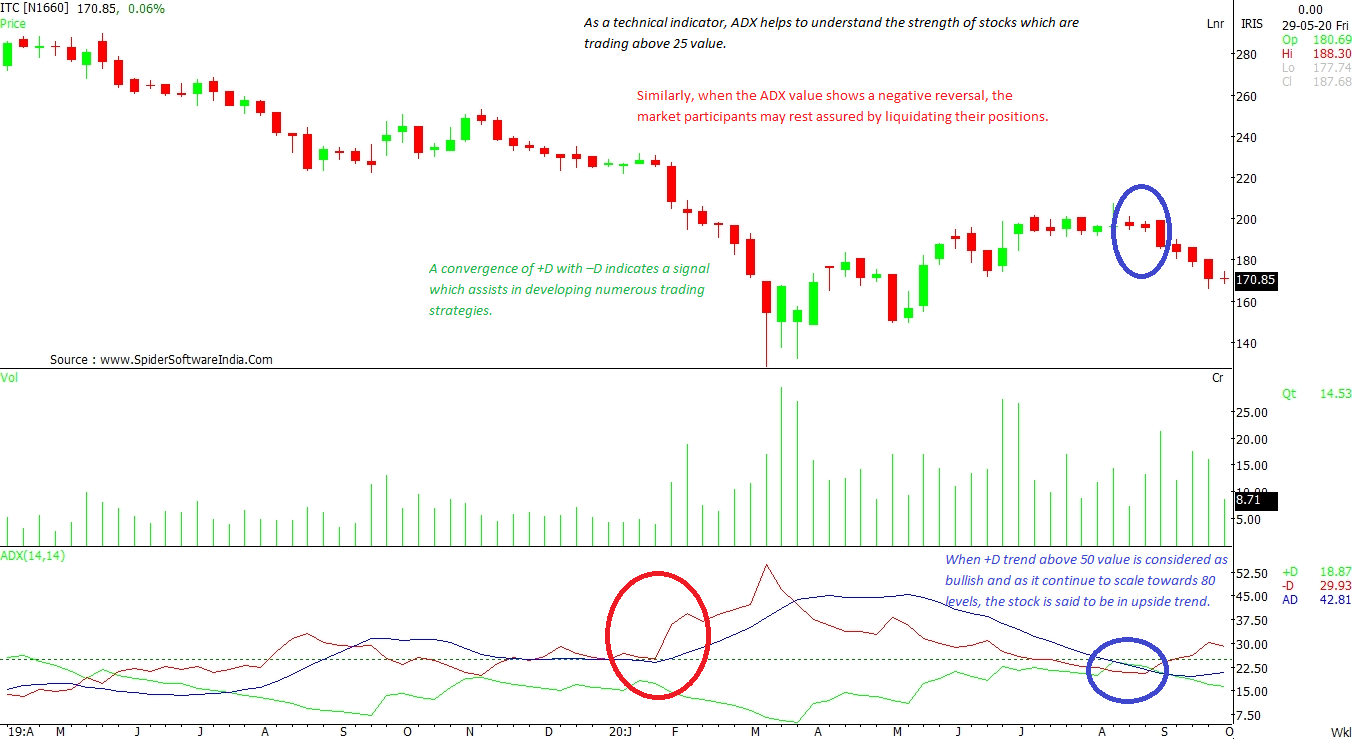
ADX ascertains a bullish trend on a bigger time frame more accurately, particularly when the price is about to scale the 25 value.
 "All you wanted to know about the Average Directional Index in trading")
premium
WebinarsNew
Deep DiveNew
Explore Business Standard
ADX ascertains a bullish trend on a bigger time frame more accurately, particularly when the price is about to scale the 25 value.
Already subscribed? Log in
Subscribe to read the full story →
3 Months
₹300/Month
1 Year
₹225/Month
2 Years
₹162/Month
Renews automatically, cancel anytime

Over 30 premium stories daily, handpicked by our editors


News, Games, Cooking, Audio, Wirecutter & The Athletic
Digital replica of our daily newspaper — with options to read, save, and share


Insights on markets, finance, politics, tech, and more delivered to your inbox
In-depth market analysis & insights with access to The Smart Investor


Repository of articles and publications dating back to 1997
Uninterrupted reading experience with no advertisements


Access Business Standard across devices — mobile, tablet, or PC, via web or app
First Published: Oct 22 2020 | 8:35 AM IST