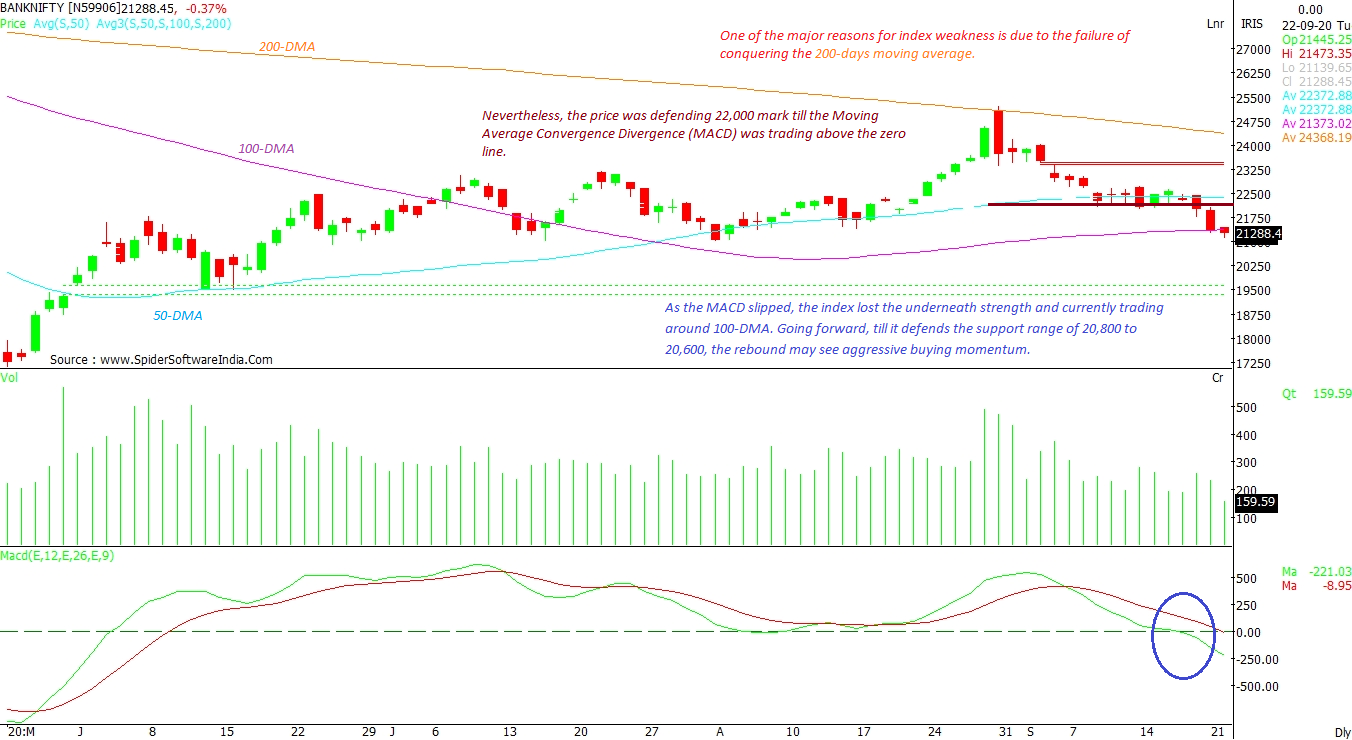
NIFTYBANK: One of the major reasons for the index's weakness is its inability to conquer the 200-day moving average (DMA). Nevertheless, the price was defending 22,000 mark till the moving average convergence divergence (MACD) was trading above the zero line. As the MACD slipped, the index lost the underneath strength and is currently trading around 100-DMA. Going forward, till it defends the support range of 20,800 to 20,600 level, the rebound may see aggressive buying momentum.
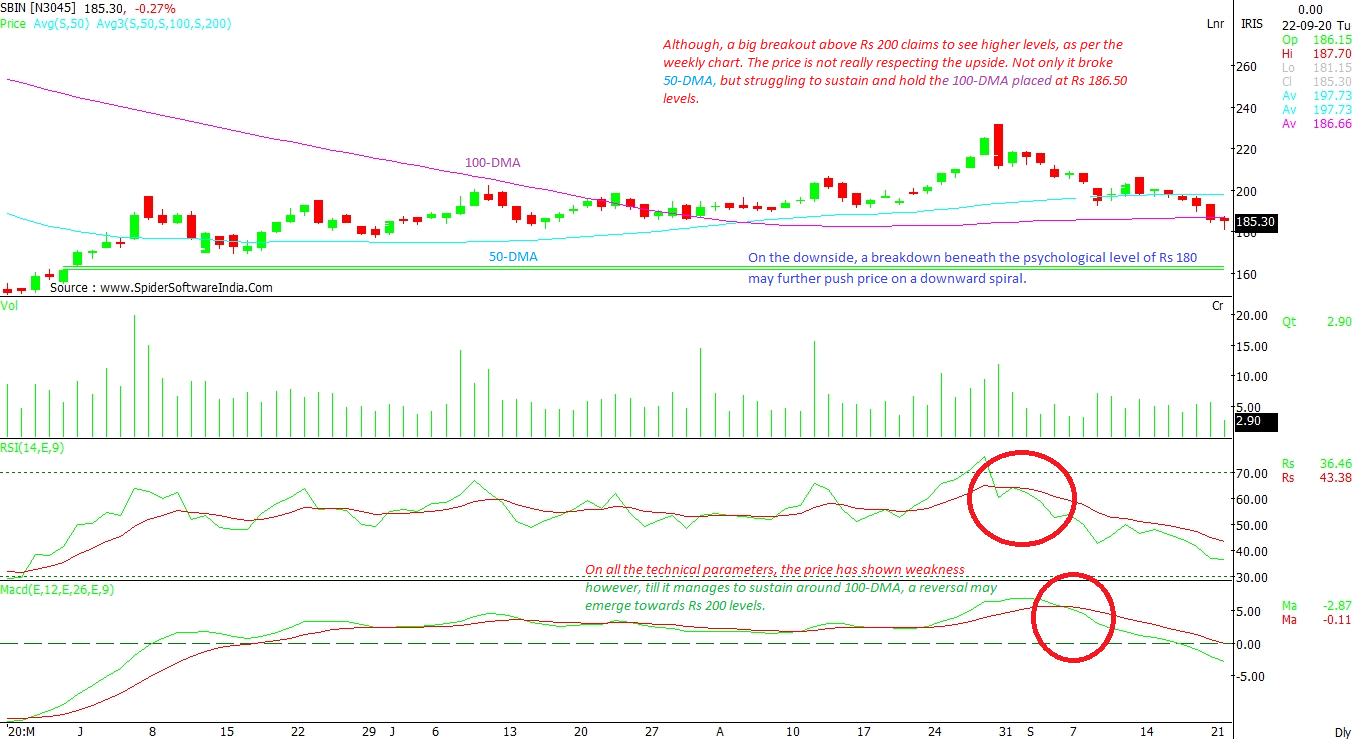
CLICK HERE FOR THE CHART State Bank of India (SBIN): Although a big breakout above Rs 200 claims to see higher levels as per the weekly chart, the price is not really respecting the upside. Not only it broke 50-DMA, but it is struggling to sustain and hold the 100-DMA placed at Rs 186.50 levels. On all the technical parameters, the price has shown weakness; however, till it manages to sustain around 100-DMA, a reversal may emerge towards Rs 200 levels. On the downside, a breakdown beneath the psychological level of Rs 180 may further push price on a downward spiral.
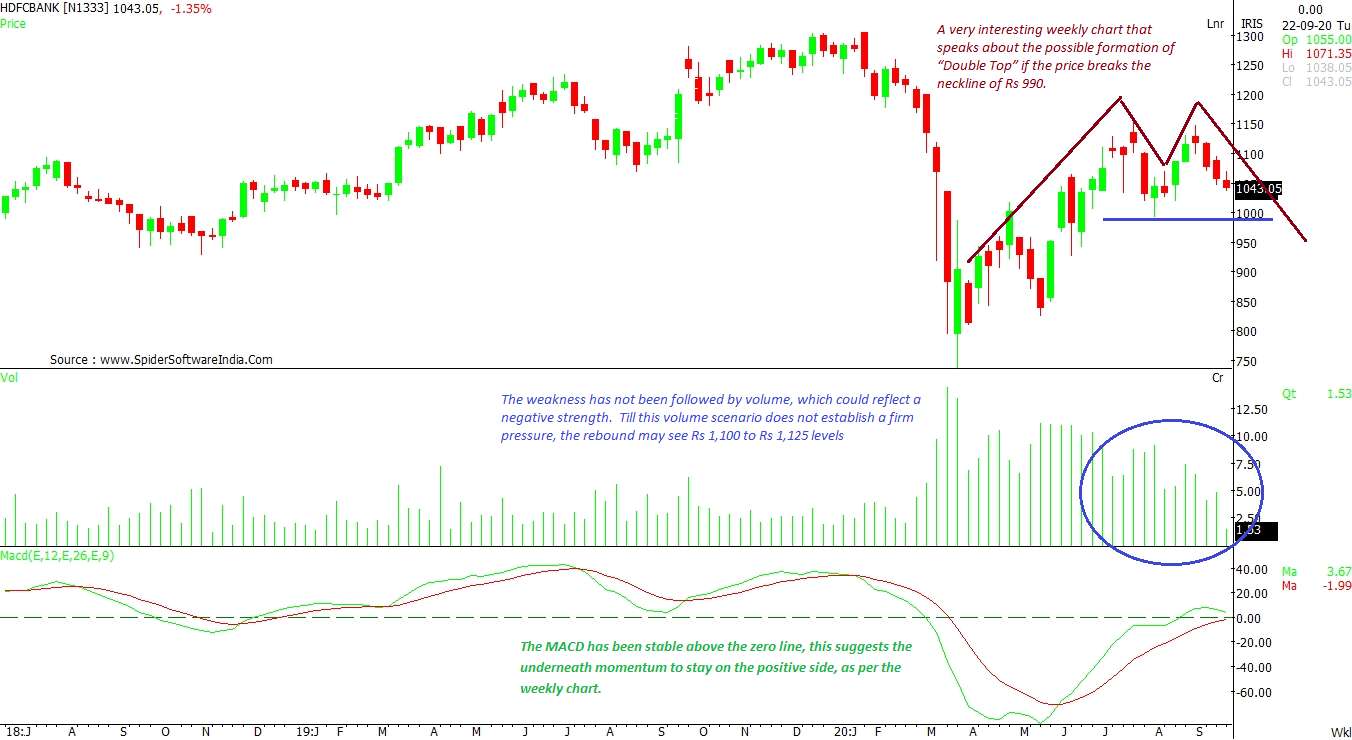
CLICK HERE FOR THE CHART HDFC Bank Ltd (HDFCBANK): The counter has formed a very interesting weekly chart that speaks about the possible formation of “Double Top” if the price breaks the neckline of Rs 990. The weakness has not been followed by volume, which could reflect a negative strength. Till this volume scenario does not establish a firm pressure, the rebound may see Rs 1,100 to Rs 1,125 levels. The MACD has been stable above the zero line, suggesting the underneath momentum to stay on the positive side, as per the weekly chart.
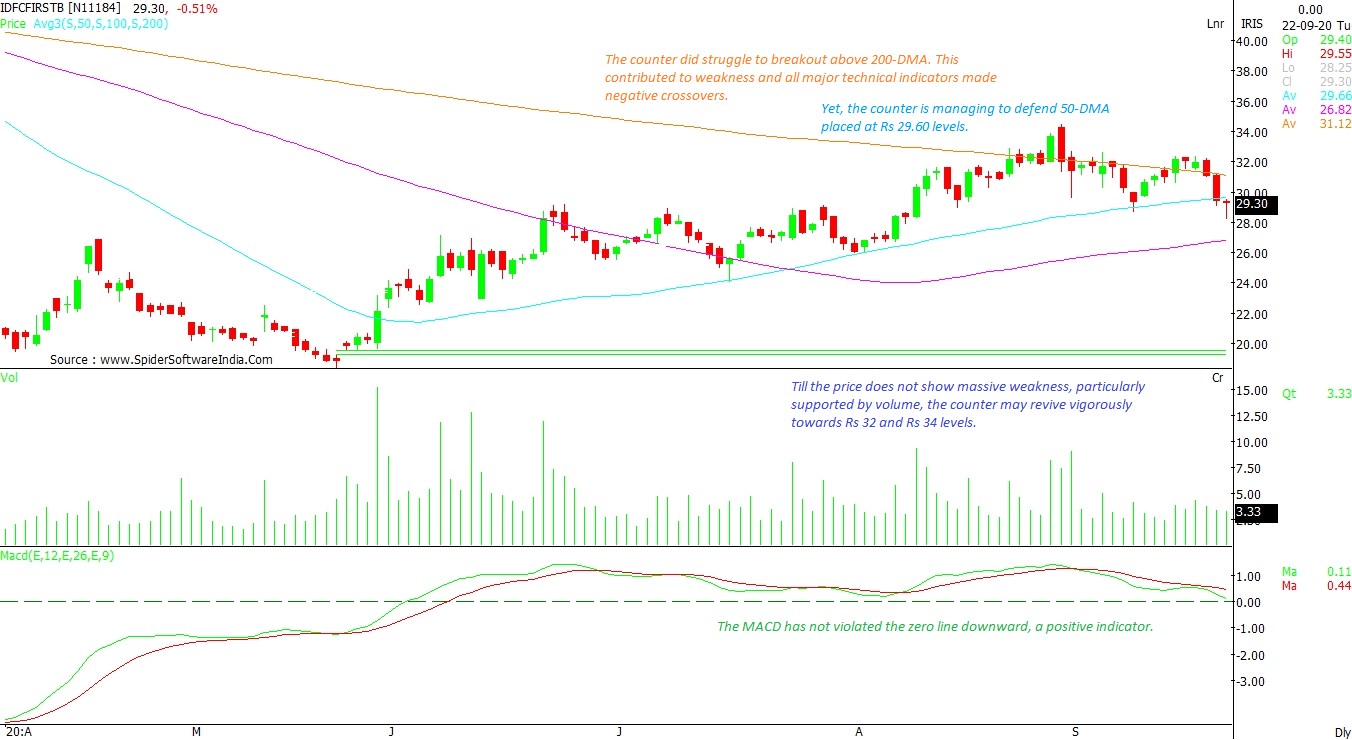
CLICK HERE FOR THE CHART IDFC First Bank Limited (IDFCFIRSTB): The counter did struggle to breakout above 200-DMA. This contributed to weakness and all major technical indicators made negative crossovers. Yet, the counter is managing to defend 50-DMA placed at Rs 29.60 levels. Till the price does not show massive weakness, particularly supported by volume, the counter may revive vigorously towards Rs 32 and Rs 34 levels. The MACD has not violated the zero line downward, which is a positive indicator.
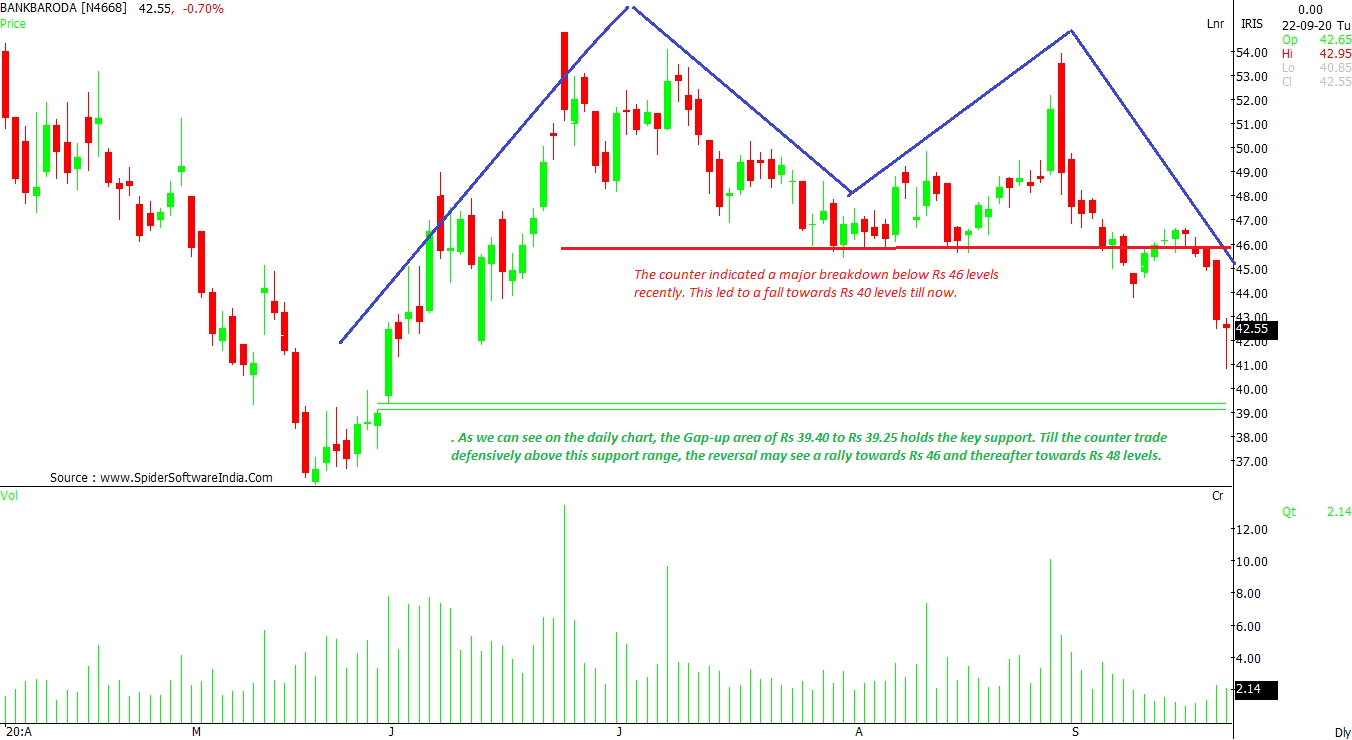
CLICK HERE FOR THE CHART BANK OF Baroda (BANKBARODA): The counter indicated a major breakdown below Rs 46 levels recently. This led to a fall towards Rs 40 levels till now. As we can see on the daily chart, the gap-up area of Rs 39.40 to Rs 39.25 holds the key support. Till the counter trade defensively above this support range, the reversal may see a rally towards Rs 46 and thereafter towards Rs 48 levels.
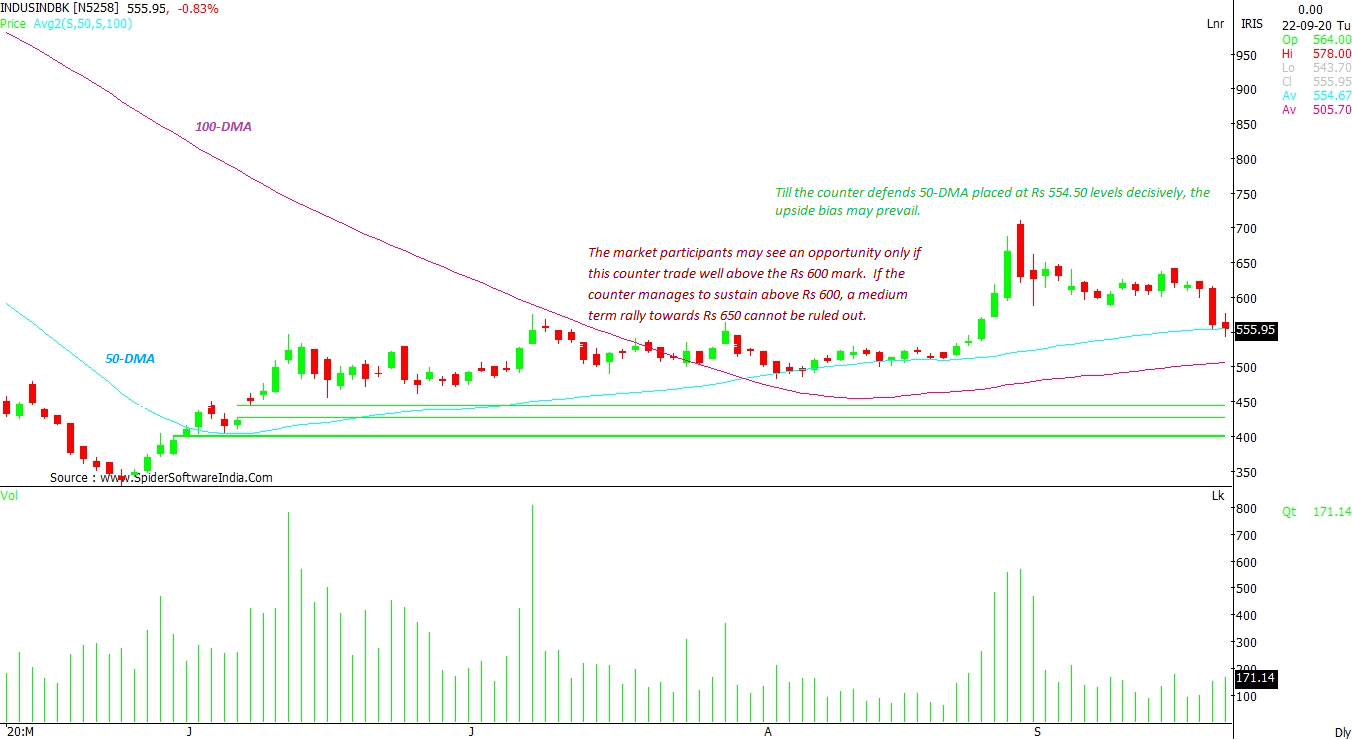
CLICK HERE FOR THE CHART IndusInd Bank Ltd (INDUSINDBK): Till the counter defends 50-DMA placed at Rs 554.50 levels decisively, the upside bias may prevail. The market participants may see an opportunity only if this counter trade well above the Rs 600 mark. If the counter manages to sustain above Rs 600, a medium term rally towards Rs 650 cannot be ruled out.
CLICK HERE FOR THE CHART  "SBI, IndusInd Bank: Are bank stocks a good bet in the current market?")


