3 min read Last Updated : Jan 13 2022 | 1:25 PM IST
Hindustan Petroleum Corporation Ltd (HINDPETRO)
Likely target: Rs 350
Upside potential: 8%
The shares of Hindustan Petroleum Corporation held the support of the 200-day moving average (DMA) near Rs 270 and succeeded to reverse with robust sentiment. This momentum conquered the Rs 309 levels, which is its 50-DMA and now shows a further upside towards Rs 350 levels, according to the daily chart. The Bollinger Band has broken out of the squeeze, reflecting that the volatility is in support of the bullish bias. CLICK HERE FOR THE CHART
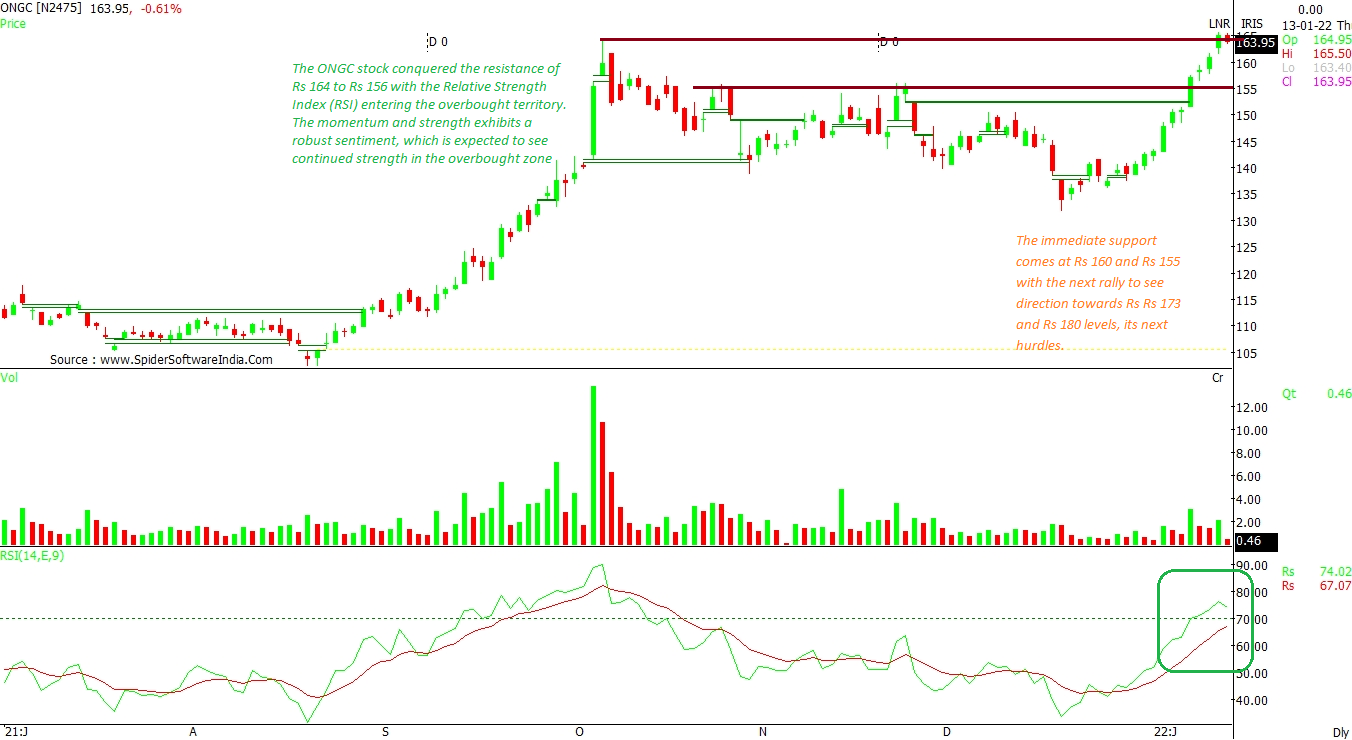
The ONGC stock conquered the resistance in the range of Rs 156 to Rs 164 with the Relative Strength Index (RSI) entering in the overbought territory. The momentum and strength exhibits a robust sentiment, which is expected to see continued strength in the overbought zone, as shown in the daily chart. The immediate support for the stock comes at Rs 160 and Rs 155 with the next rally to see direction towards Rs Rs 173 and Rs 180 levels, its next hurdles. CLICK HERE FOR THE CHART
Pidilite Industries Ltd (PIDILITIND)
Likely target: Rs 3,000
Upside potential: 8.50%
The stock continues to scale higher levels in the overbought category of RSI. And unless the support of Rs 2,700, followed by Rs 2,610 does not get violated, the positive bias is here to stay for some more time. The counter continues to claim new territories with a very strong optimism. The bigger trend seems headed towards Rs 3,000 levels. CLICK HERE FOR THE CHART
BERGER PAINTS INDIA (BERGEPAINT)
Likely target: Rs 840
Upside potential: 7%
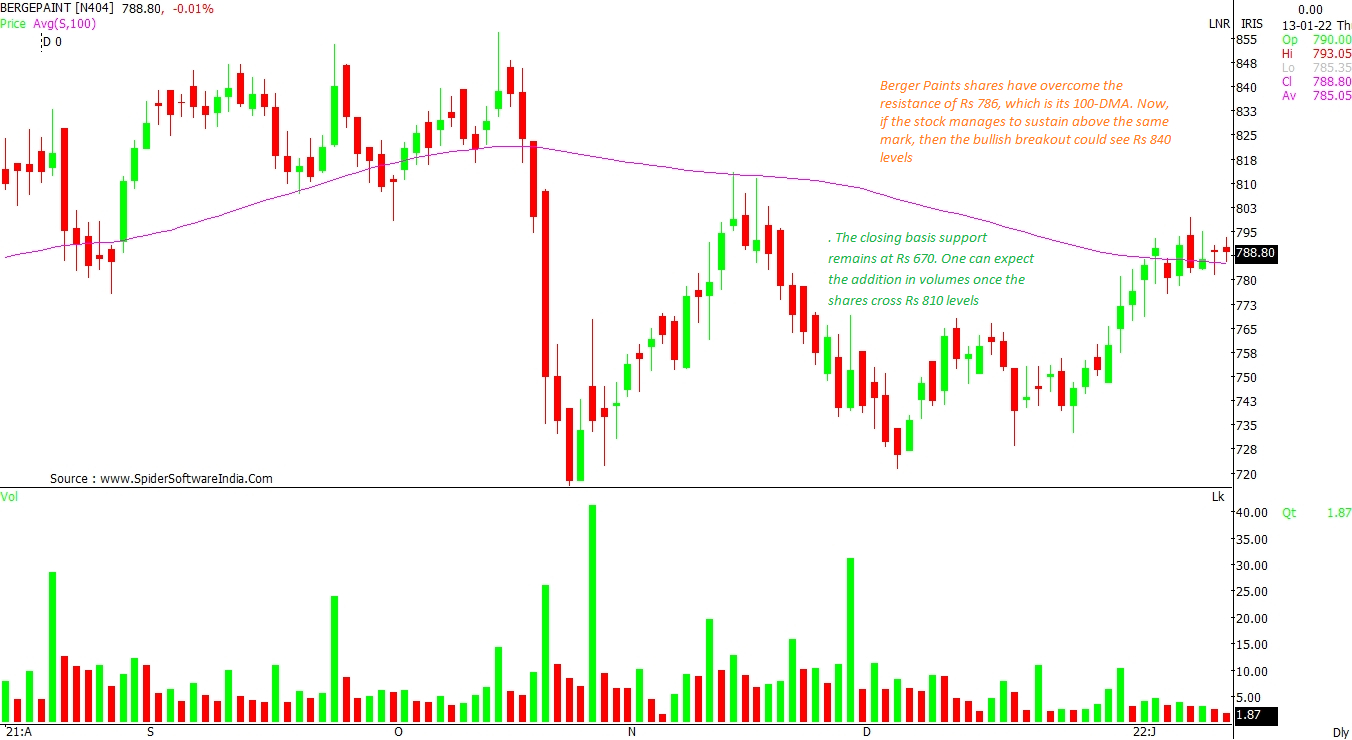
Berger Paints shares have overcome the resistance of Rs 786, which is its 100-DMA. Now, if the stock manages to sustain above the same mark, then the bullish breakout could see Rs 840 levels. The closing basis support remains at Rs 670. One can expect the addition in volumes once the shares crosses Rs 810 levels, according to the daily chart. CLICK HERE FOR THE CHART
Hindustan Oil Exploration Company Ltd (HINDOILEXP)
Likely target: Rs 250
Upside potential: 9%
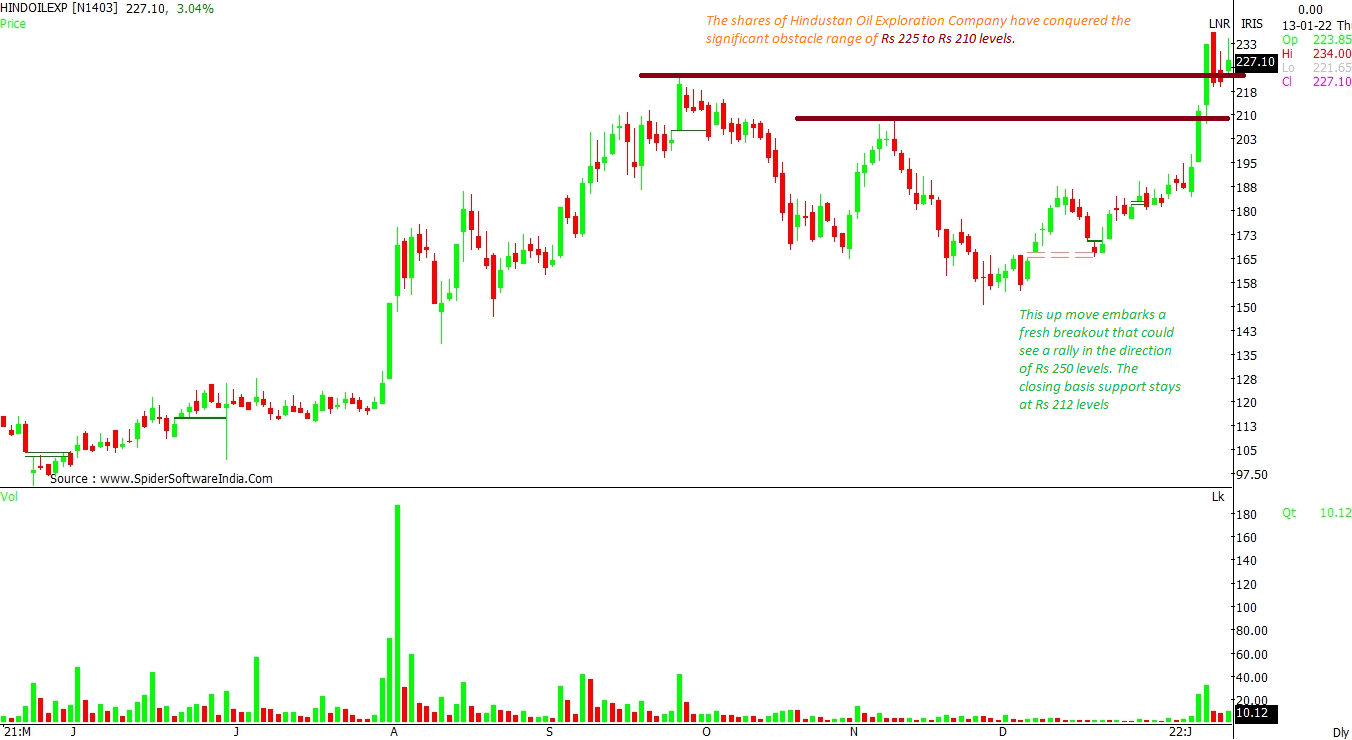
The shares of Hindustan Oil Exploration Company have conquered the significant obstacle range of Rs 225 to Rs 210 levels. This move embarks a fresh breakout that could see a rally in the direction of Rs 250 levels. The closing basis support stays at Rs 212 levels, according to the daily chart. CLICK HERE FOR THE CHART
 "Brent tests $85: Invest in these stocks to benefit from surging oil prices")


