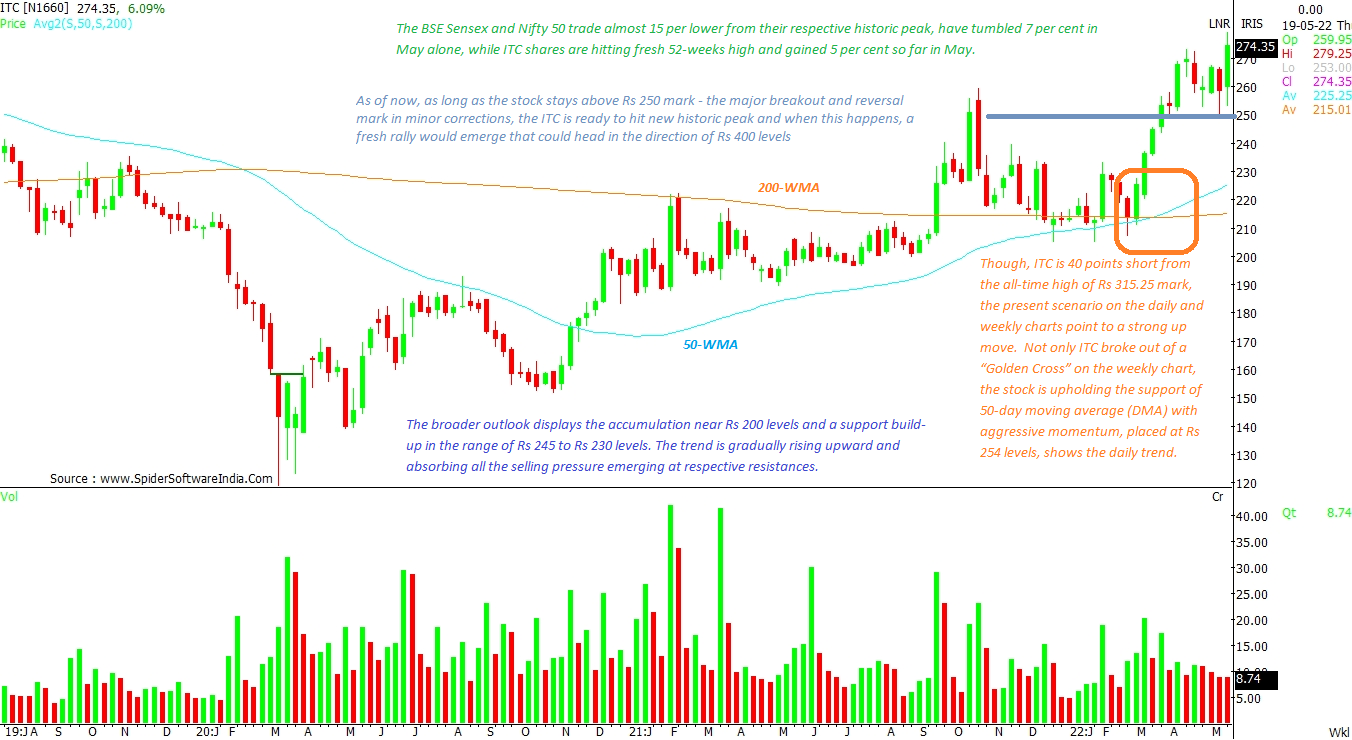
Chart check: ITC could jump 40% on fresh breakouts, may hit Rs 400-mark

Though ITC is 40 points short from its all-time high of Rs 315.25-mark, the present scenario on the daily and weekly charts point to a strong up move

ITC
Photo: ShutterStock
Avdhut Bagkar Mumbai
2 min read Last Updated : May 19 2022 | 11:33 AM IST
Traders and investors were eagerly looking forward to ITC's Q4 results as the stock was one of the few counters which held ground in the current bloodbath in benchmark indices. 

While the BSE Sensex and the Nifty 50 have tumbled 7 per cent in May alone, down almost 15 per cent from their respective historic peak, ITC shares have been hitting fresh 52-weeks high and have gained 5 per cent so far in May.

On Thursday, shares of ITC hit an over three-year high of Rs 279.15, surging 5 per cent on the BSE, after the company reported strong results with around 9 per cent cigarette volume growth in March quarter (Q4FY22). The stock of the cigarettes-to-hotels major hit its highest level since July 2019, when it hit a high of Rs 282.95. READ MORE

ITC reported quarterly results on Wednesday with net profit rising 11.8 per cent amid revenue growth across verticals. The non- cigarette business recorded an increase of 12.32 per cent, while cigarette business rose 9.96 per cent.

Though ITC is 40 points short from its all-time high of Rs 315.25-mark, the present scenario on the daily and weekly charts point to a strong up move.  Not only has the stock of ITC broken out from a "Golden Cross" pattern on the weekly chart, the stock is upholding the support of 50-day moving average (DMA), placed at Rs 254 levels, with aggressive momentum, shows the daily trend.

As of now, as long as the stock stays above Rs 250-mark - the major breakout and reversal mark in minor corrections - it is ready to hit a new historic peak. Given this, a fresh rally towards Rs 400 levels can't be ruled out over the next 3-6 months, as per the daily and weekly setup.

The present scenario on charts indicates 14 per cent upside and a fresh breakout, thereof, could see another 26 per cent surge. Overall, a 40 per cent jump in ITC shares cannot be denied as per the technical set up. 

The broader outlook displays accumulation near Rs 200 levels and a support build-up in the range of Rs 245 to Rs 230 levels. The trend is gradually rising upward and absorbing all the selling pressure emerging at respective resistances. CLICK HERE FOR THE CHART

One subscription. Two world-class reads.

Already subscribed? Log in

Subscribe to read the full story →
*Subscribe to Business Standard digital and get complimentary access to The New York Times

Smart Quarterly

₹900

3 Months

₹300/Month

SAVE 25%

Smart Essential

₹2,700

1 Year

₹225/Month

SAVE 46%
*Complimentary New York Times access for the 2nd year will be given after 12 months

Super Saver

₹3,900

2 Years

₹162/Month

Subscribe

Renews automatically, cancel anytime

Here’s what’s included in our digital subscription plans

Exclusive premium stories online

  • Over 30 premium stories daily, handpicked by our editors

Complimentary Access to The New York Times

  • News, Games, Cooking, Audio, Wirecutter & The Athletic

Business Standard Epaper

  • Digital replica of our daily newspaper — with options to read, save, and share

Curated Newsletters

  • Insights on markets, finance, politics, tech, and more delivered to your inbox

Market Analysis & Investment Insights

  • In-depth market analysis & insights with access to The Smart Investor

Archives

  • Repository of articles and publications dating back to 1997

Ad-free Reading

  • Uninterrupted reading experience with no advertisements

Seamless Access Across All Devices

  • Access Business Standard across devices — mobile, tablet, or PC, via web or app

Topics :ITC LtdQ4 Resultsinvest indiaMarketsMarket trendsFMCG stocks

Next Story