Tech view: Here's how you can make money in RIL, SBI, Maruti and Axis Bank

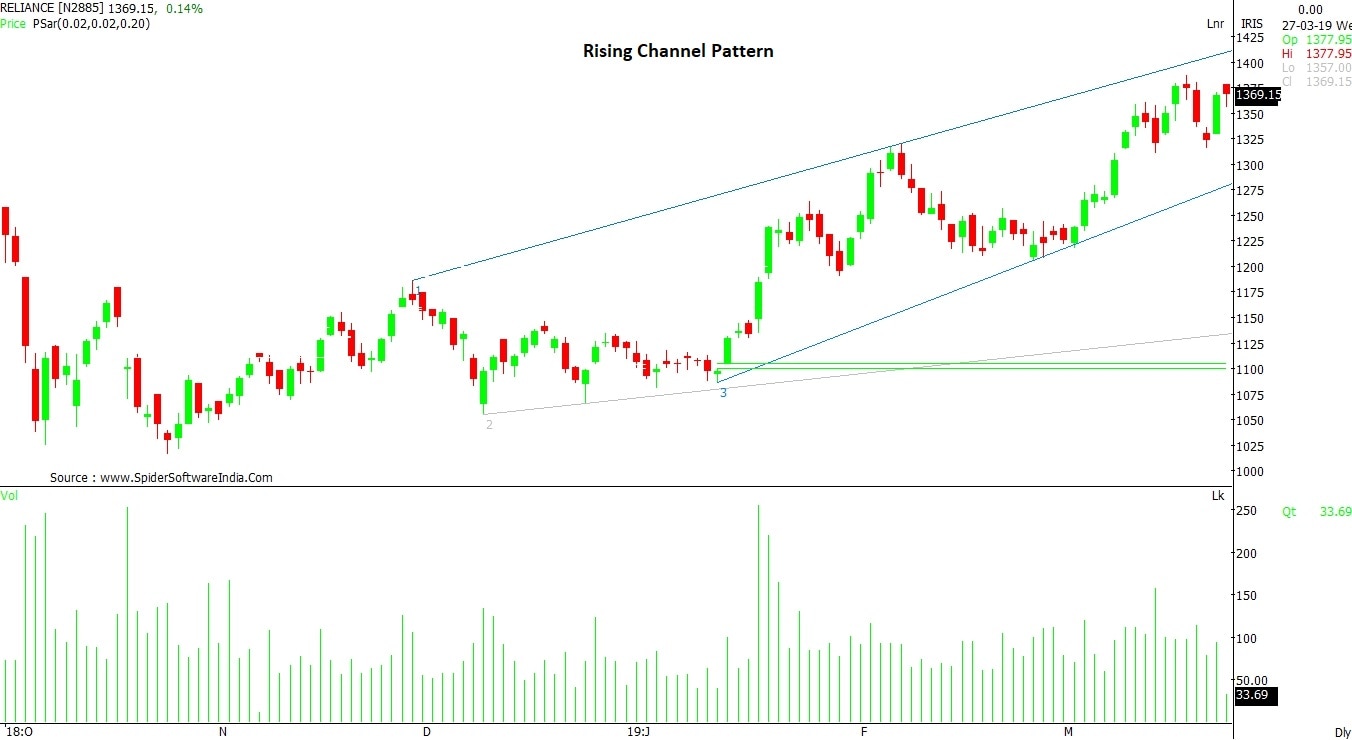
Currently, Rs 1,300 stands as immediate support for Reliance Industries stock, subsequently followed by Rs 1,260 level.

algo trading
Avdhut Bagkar Mumbai
3 min read Last Updated : Mar 27 2019 | 1:00 PM IST
The upward rising trend line on Nifty50 chart showed resistance around 11,550. It witnessed minor sell-off, before strongly reversing towards 11,500 level yesterday. A jump of 129 points or 1.14 per cent has brought back the positive sentiment.

The index has risen tremendously in the last ten sessions, advancing more than 5 per cent holding high optimism. All the leading technical indicators RSI (Relative Strength Index), MACD (moving average convergence and divergence) and Stochastic are supportive of the up move, trading away from overbought territory.

As of now, the trend remains upward as Nifty50 is witnessing buying on corrective moves. The support levels are 11,350, 11,210 and 11,060 with a rally towards resistance levels of 11,620, 11,750 and 11,880. A key significance is a gap-up closing in this rally which has strengthened the upside trend. CLICK HERE TO VIEW CHART

Key drivers of the rally are:-

RELIANCE INDUSTRIES (RELIANCE): The monthly chart denotes breakout above Rs 1,340 incorporating rising volumes and interest of investors. The daily chart shows “rising channel formation” with a rally toward upward rising trend line currently placed at Rs 1,415 level. Currently, Rs 1,300 stands as immediate support subsequently followed by Rs 1,260 level. The candlestick pattern indicates “Bullish Morning Star” suggesting a positive reversal, having a strong close after a short-bodied candle. This move precedes a candlestick breakout above Rs 1,372 level. CLICK HERE TO VIEW CHART

STATE BANK OF INDIA (SBI): The stock has always seen selling pressure in the range of Rs 320 – Rs 300 levels. Having said so, it is currently breaking out of “Symmetrical Triangle pattern”, as per the weekly chart. It needs to withhold the volumes for a sustained rise. Any downside here onwards, having high volumes will negate the breakout scenario. The strong support comes in at Rs 260, as per weekly chart; however, Rs 278 seems favorable for a short term view. If it manages to cross Rs 320 with sustained volumes, then may see Rs 350 and Rs 365. CLICK HERE TO VIEW CHART

ICICI BANK (ICICIBANK): The stock has consistently risen in last nine months displaying “Higher top, higher bottom” formation, as per weekly chart. Currently, resisting at Rs 400 levels; the stock is showing a buying scenario between Rs 380 – Rs 375 levels. This range holds support for any correction. It needs to see the addition of volumes for a bigger rise. Prices are moving higher but volumes are lacking.  CLICK HERE TO VIEW CHART

AXIS BANK LIMITED (AXISBANK): The stock is roaring with new lifetime highs. The recent trading sessions have seen buying at every new high. The bigger chart scale shows “above average volumes” getting traded at higher price levels anticipating positive strength. MACD is trading above zero line from last five months, RSI still trades far from overbought territory. The immediate support comes in at Rs 730 with a trend heading towards Rs 810 and Rs 840. CLICK HERE TO VIEW CHART

MARUTI SUZUKI INDIA (MARUTI): The recent correction anticipates more pain for the stock. The upside moves have displayed selling pressure and more shorting opportunities. It needs to hold and trade above Rs 6,300 firmly to regain the losing momentum. Anything below the said level may see a bigger downside. The real strength will gain momentum only above Rs 7,200 and at current levels, the stock stays in no-trade zone, as per chart. It is trading below significant moving averages 50-day moving average (DMA), 100-DMA and 200 DMA on the daily chart. MACD has slipped below the zero lines. CLICK HERE TO VIEW CHART

One subscription. Two world-class reads.

Already subscribed? Log in

Subscribe to read the full story →
*Subscribe to Business Standard digital and get complimentary access to The New York Times

Smart Quarterly

₹900

3 Months

₹300/Month

SAVE 25%

Smart Essential

₹2,700

1 Year

₹225/Month

SAVE 46%
*Complimentary New York Times access for the 2nd year will be given after 12 months

Super Saver

₹3,900

2 Years

₹162/Month

Subscribe

Renews automatically, cancel anytime

Here’s what’s included in our digital subscription plans

Exclusive premium stories online

  • Over 30 premium stories daily, handpicked by our editors

Complimentary Access to The New York Times

  • News, Games, Cooking, Audio, Wirecutter & The Athletic

Business Standard Epaper

  • Digital replica of our daily newspaper — with options to read, save, and share

Curated Newsletters

  • Insights on markets, finance, politics, tech, and more delivered to your inbox

Market Analysis & Investment Insights

  • In-depth market analysis & insights with access to The Smart Investor

Archives

  • Repository of articles and publications dating back to 1997

Ad-free Reading

  • Uninterrupted reading experience with no advertisements

Seamless Access Across All Devices

  • Access Business Standard across devices — mobile, tablet, or PC, via web or app

Next Story