Meanwhile, here's a quick outlook on 5 commodities related stocks that are likely to benefit from rising commodity prices:
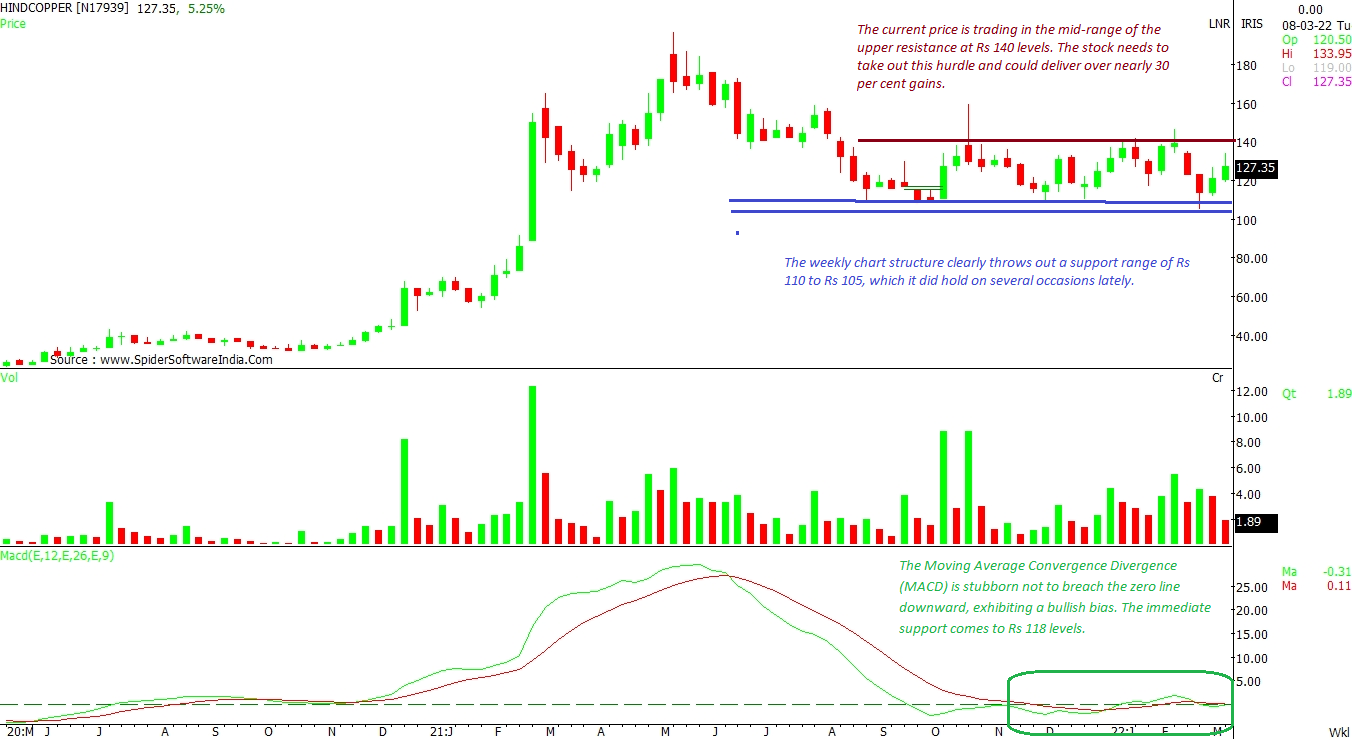
Hindustan Copper Ltd (HINDCOPPER) Likely target: Rs 180 (after crossing Rs 140)
Upside potential: 30%
The weekly chart structure clearly show a support range of Rs 110 to Rs 105, which the stock did hold on several occasions lately. The current price is trading in the mid-range of the upper resistance at Rs 140 level. The stock needs to take out this hurdle, post which it can deliver over 30 per cent gains. The Moving Average Convergence Divergence (MACD) is stubborn not to breach the zero line downward, exhibiting a bullish bias. The immediate support for the stock exists at Rs 118.
CLICK HERE FOR THE CHART Balrampur Chini Mills Ltd (BALRAMCHIN) Likely target: Rs 500 and Rs 550 (above Rs 450)
Upside potential: 11% to 22%
Shares of Balrampur Chini Mills are seen attempting to overcome the selling resistance at Rs 450 level, as per the weekly chart. The probability to take out this hurdle is significantly higher as the stock constantly hits the upper roof; as and when it succeeds the trend breakout could see Rs 500 and Rs 550 in immediate trading sessions. The bullish outlook is protected with the support of Rs 380, that needs to be considered on a weekly closing basis.
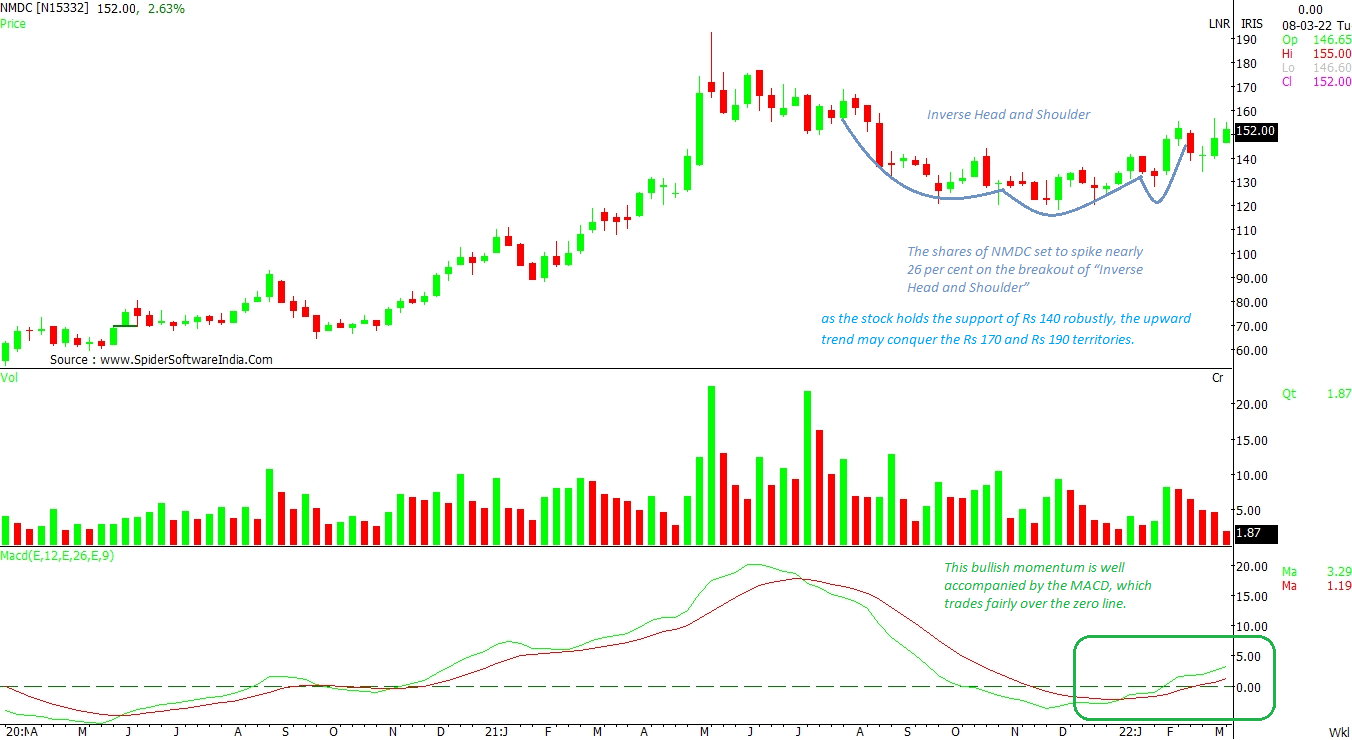
CLICK HERE FOR THE CHART Also read: Tracking historical trends: How crude oil prices, stock valuations seesaw NMDC Ltd (NMDC) Likely target: Rs 170 and Rs 190
Upside potential: 13% to 26%
The shares of NMDC seem set to spike nearly 26 per cent on the breakout of “Inverse Head and Shoulder”, as shown on the weekly chart. This momentum is well accompanied by the MACD, which trades fairly over the zero line. Now, as the stock holds the support of Rs 140 robustly, the upward trend may conquer the Rs 170 and Rs 190 territories.
CLICK HERE FOR THE CHART Hindustan Zinc Ltd (HINDZINC) Likely target: 18% (consecutive close above Rs 340)
Upside potential: Rs 400
This stock is struggling to conquer the selling pressure above Rs 340 level, shows the weekly chart. The stock needs to consecutively close above the same to defeat the bear influx. Once that is achieve, the stock can easily jump another 15-20 per cent. The medium-term trend for the stock will remain up above the Rs 300-mark.
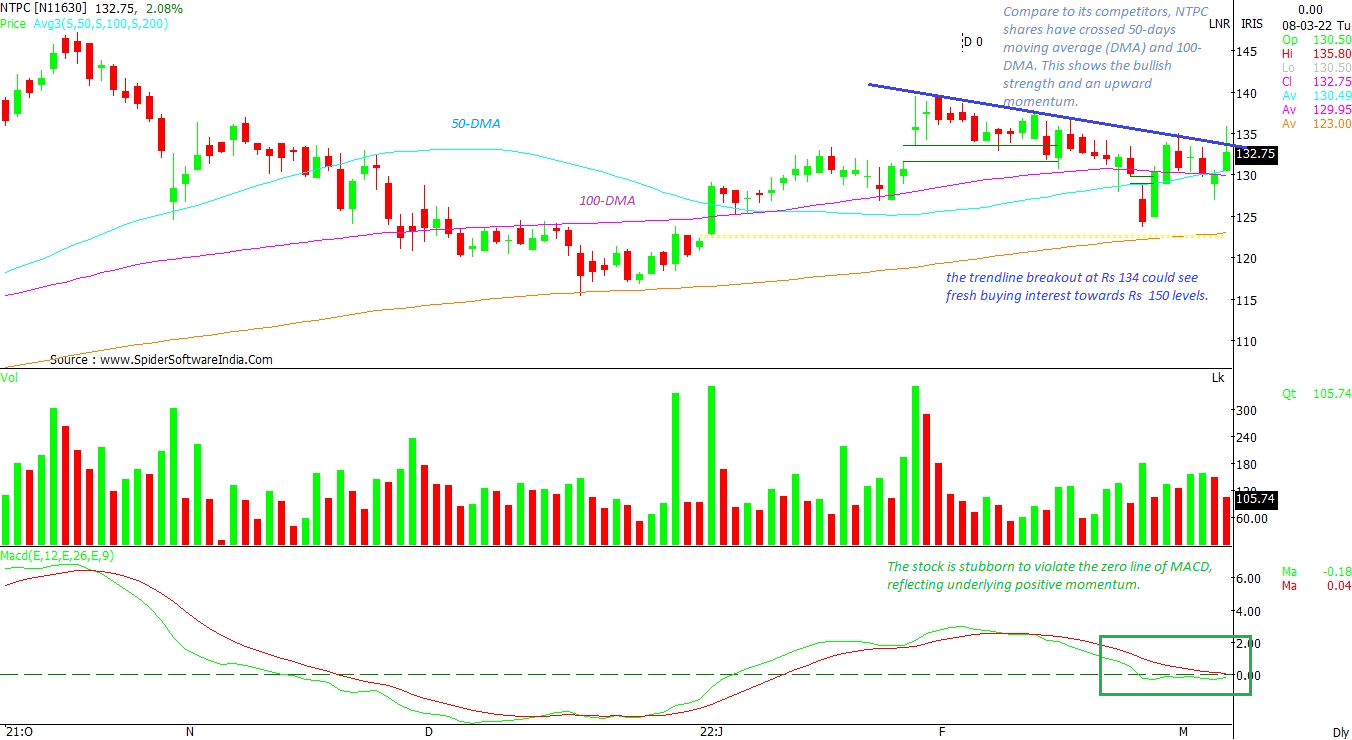
CLICK HERE FOR THE CHART NTPC Ltd (NTPC) Likely target: Rs 150
Downside potential: 12%
When compared to its competitors, NTPC shares have crossed the 50-day moving average (DMA) and 100-DMA. This shows the bullish strength and an upward momentum. That said, moving averages are placed at Rs 130.50 and Rs 129 respectively. The stock is stubborn to violate the zero line of MACD, reflecting underlying positive momentum. Now, the trendline breakout at Rs 134 could see fresh buying interest towards Rs 150-mark.
CLICK HERE FOR THE CHART  "Commodity boom! Hind Copper, NTPC, NMDC to see up to 30% rally")


