Most pharma stocks have witnessed a huge upside so far in the calendar year 2020 (CY20). On a year-to-date (YTD) basis, the Nifty Pharma index has rallied over 45 per cent (as of Wednesday's close) as against nearly 5 per cent drop in the benchmark Nifty50 index, ACE Equity data show.
On Thursday, in the morning deals, the Nifty Pharma index was trading nearly 0.5 per cent higher at 11,742 levels with 6 out of 10 constituents advancing.
Here's a look at what charts indicate for Nifty Pharma and some of its constituents.
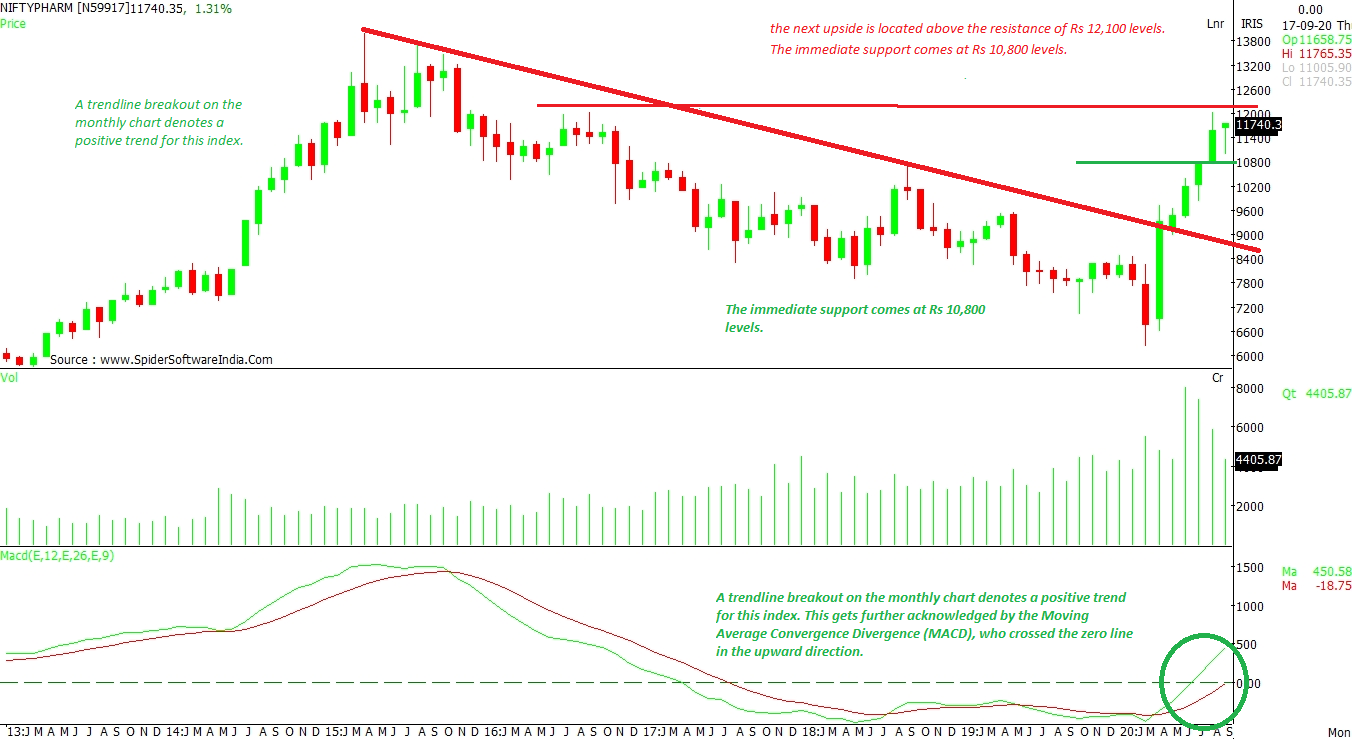
Nifty Pharma: A trendline breakout on the monthly chart indicates a positive trend for this index. This gets further confirmed by the Moving Average Convergence Divergence (MACD), which crossed the zero line in the upward direction. That said, the next upside is located above the resistance of 12,100 levels. The immediate support comes in at 10,800 levels.
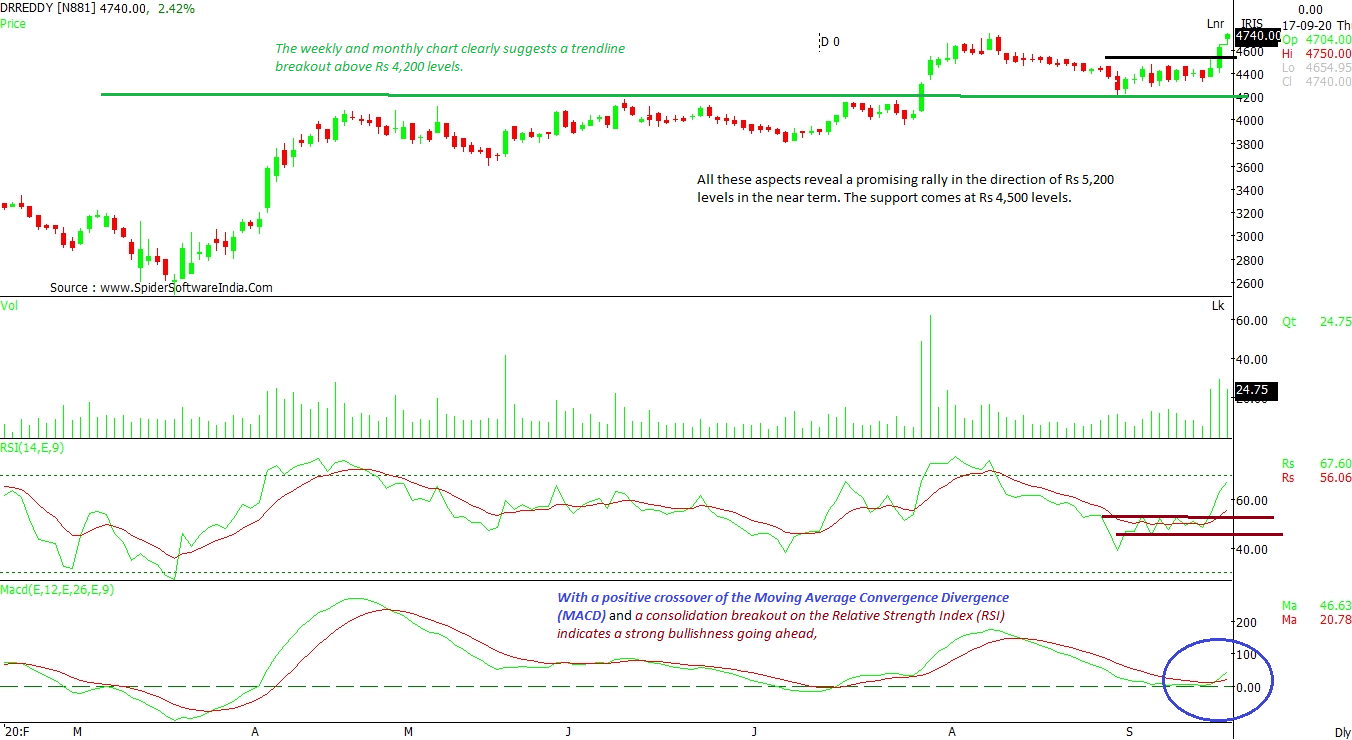
CLICK HERE FOR THE CHART Dr Reddy's: A positive crossover of MACD and a consolidation breakout on the Relative Strength Index (RSI) suggest a strong bullishness going ahead, as per the daily chart. The weekly and monthly chart clearly suggests a trendline breakout above Rs 4,200 levels. All these trends signal a promising rally in the direction of Rs 5,200 levels in the near term. The support comes in at Rs 4,500 levels.
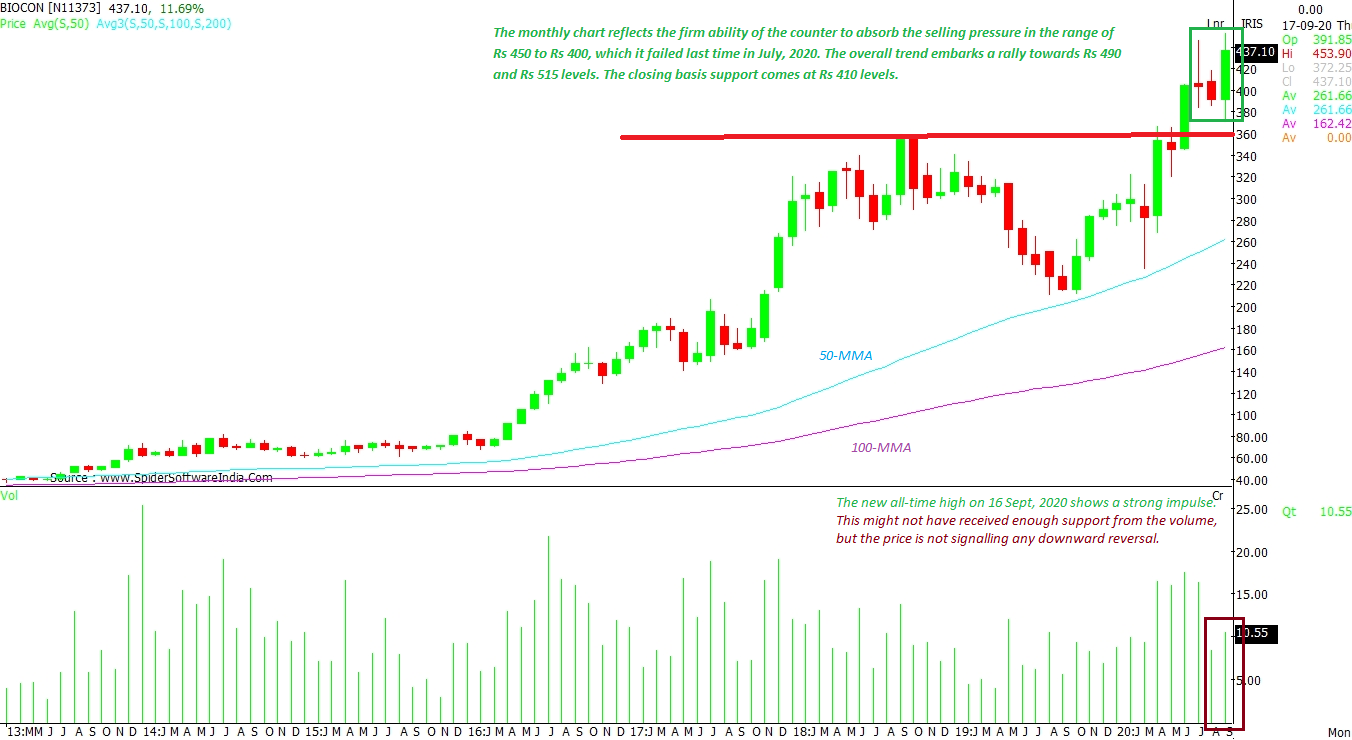
CLICK HERE FOR THE CHART Biocon Ltd (BIOCON): The new all-time high touched on Wednesday indicates a strong rally. This might not have received enough support from the volume, but the price is not signalling any downward reversal. The monthly chart reflects the firm ability of the counter to absorb the selling pressure in the range of Rs 450 to Rs 400, which it failed last time in July, 2020. The overall trend indicates a rally towards Rs 490 and Rs 515 levels. The closing basis support is placed at Rs 410 levels.
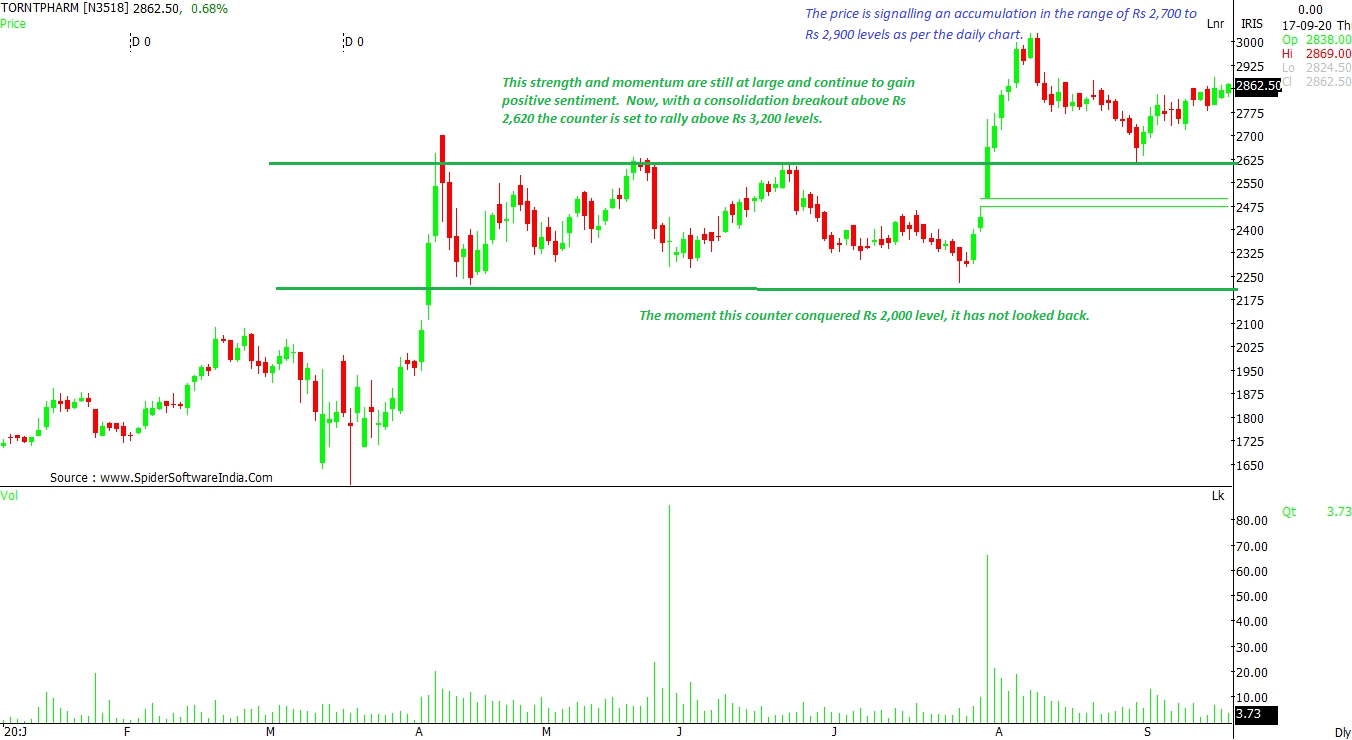
CLICK HERE FOR THE CHART Torrent Pharmaceuticals Ltd (TORNTPHARM): There is no looking back for this counter since it crossed Rs 2,000 level. This strength and momentum are still intact and the stock will continue to gain positive sentiment. With a consolidation breakout above Rs 2,620, the counter is set to rally above Rs 3,200 levels. The price is signalling an accumulation in the range of Rs 2,700 to Rs 2,900 levels, as per the daily chart.
CLICK HERE FOR THE CHART  "Dr Reddy's, Biocon, Torrent Pharma: What charts indicate for these stocks")


