Here’s how the stock looks on the technical parameters.
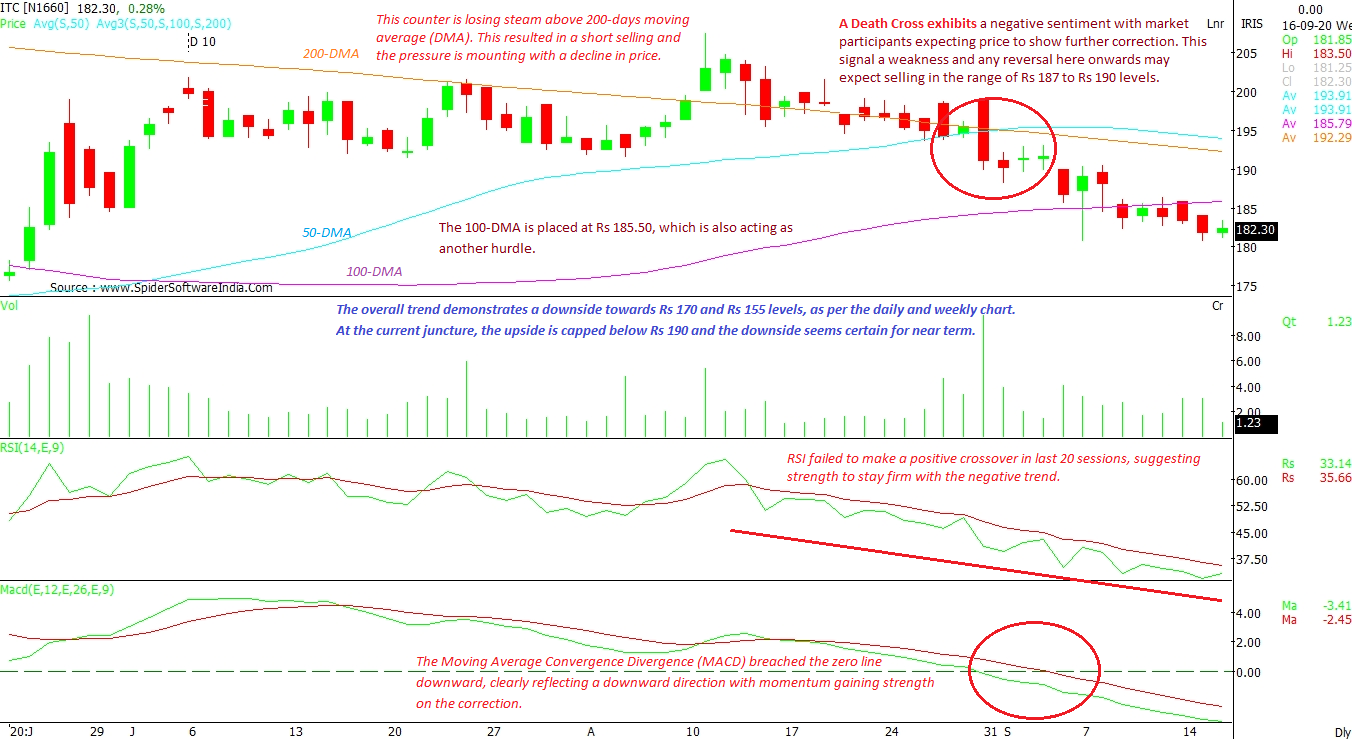
This counter has consistently failed to stay above the above 200-days moving average (DMA) despite repeated attempts, which has tested the patience of investors, who have resorted to short selling. As we can see on the daily chart, there is a negative crossover of 50-DMA with 200-DMA, signalling a “Death Cross”.
CLICK HERE FOR THE CHART A Death Cross exhibits a negative sentiment with market participants expecting the price to show further correction in the sessions ahead. The stock is looking weak on the charts and one can expect selling to emerge again in the range of Rs 187 to Rs 190 levels. The 100-DMA is placed at Rs 185.50, which is also acting as another hurdle.
The Relative Strength Index (RSI) have also failed to make a positive crossover in the last 20 sessions, suggesting the negative trend to persist for a while. The Moving Average Convergence Divergence (MACD) has breached the zero line downward, which is clearly reflecting a downward direction with the possibility of correction from the current levels.
The overall trend predicts a slide towards Rs 170 and then Rs 155 levels, as per the daily and weekly charts. At the current juncture, the upside is capped at Rs 190 and the downside seems certain in the near term.
 "Stuck with an investment in ITC? Here's how the stock looks on the charts")


