Here's how you can tell if a stock is under consolidation

Unless there is a breakout with definite consecutive closes, one should not be too quick to 'confirm' a trend. It is very essential to ascertain a trend; sometimes, having a dull scenario on the chart

No direction of a trend
During consolidation, one can often spot candlestick patterns like doji, spinning top, and hammer.
Avdhut Bagkar Mumbai
3 min read Last Updated : Oct 01 2020 | 8:54 AM IST
Consolidation is a phase in the markets in which a stock or an index trades within a specific range, between the 'support' and resistance' levels. The price reverses from specific lower levels -- the support -- and faces selling pressure at higher levels -- the resistance. This scenario, by and large, defines consolidation.

How to identify consolidation

-- During consolidation, the price trades in a certain range with subdued volumes. It faces selling pressure on the upside, near the same levels where supply was witnessed earlier. Similarly, when the price corrects, it rebounds from the levels where buying emerged earlier. Volumes stay low, barring a few swings that can be overlooked.

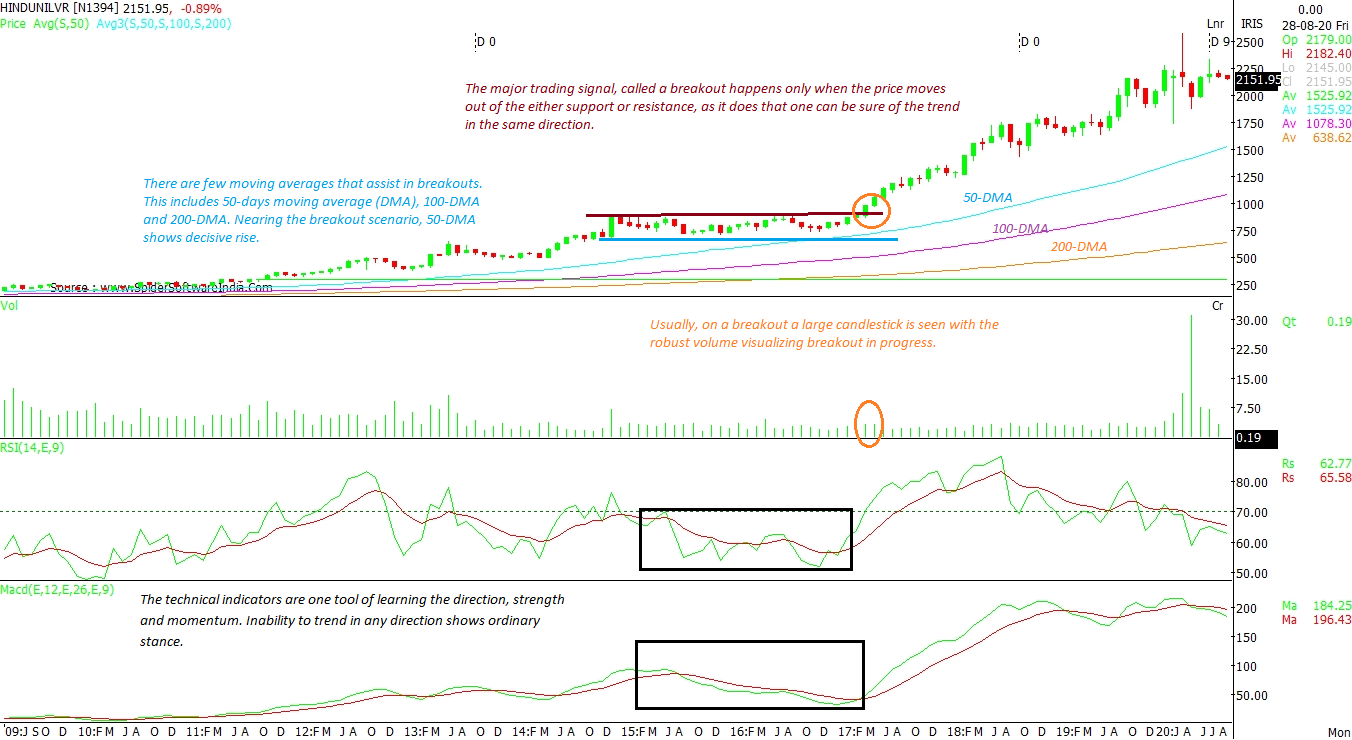
-- Technical indicators like RSI and MACD show sideways movement during this phase of the markets. Technical indicators are one tool to identify the direction, strength and momentum of the trend. The indicators' inability to trend in any specific direction depicts a consolidation phase.

-- During consolidation, one can often spot candlestick patterns like doji, spinning top, and hammer. Usually, on a breakout, a large candlestick is seen with robust volume, visualizing that a breakout is in progress.

-- Unless there is a breakout with definite consecutive closes, one should not be too quick to 'confirm' a trend. It is very essential to ascertain a trend; sometimes, having a dull scenario on the charts might result in a buildup of shorting positions.

How to trade during consolidation phase

Consolidation shows price moving in a sideways manner, and this exhibits accumulation or exhaustion. When considering any trade, the upside resistance and downside support must be acknowledged. Till the time the support levels are intact and the price does not extend its decline, the reversal opportunity may provide decent returns. Consolidation breakouts have a target which is usually the difference of support and resistance levels.

The major trading signal, called a breakout, happens only when the price moves out of this zone, by breaching either the support or resistance level. There are few moving averages that assist in identifying breakouts. This includes a 50-day moving average (DMA), 100-DMA and 200-DMA. Nearing the breakout scenario, 50-DMA shows a decisive rise. Any convergences of the moving averages further strengthens the trend in the short term. CLICK HERE FOR THE CHART

Consolidation in monthly and weekly charts

A stock's major outlook can be easily studied on its monthly chart. When a price breaks out of consolidation, a major move can be witnessed over a long period of time. This merely explains the investment perspective. Longer the consolidation, the bigger the price move.  The sentiment explains the intensity of follow-up buying expected to emerge on the breakout. This triggers a major increase in volumes and, inherently, the price shows buying momentum on correction moves. The stop loss can be placed slightly lower than the breakout candle.

One subscription. Two world-class reads.

Already subscribed? Log in

Subscribe to read the full story →
*Subscribe to Business Standard digital and get complimentary access to The New York Times

Smart Quarterly

₹900

3 Months

₹300/Month

SAVE 25%

Smart Essential

₹2,700

1 Year

₹225/Month

SAVE 46%
*Complimentary New York Times access for the 2nd year will be given after 12 months

Super Saver

₹3,900

2 Years

₹162/Month

Subscribe

Renews automatically, cancel anytime

Here’s what’s included in our digital subscription plans

Exclusive premium stories online

  • Over 30 premium stories daily, handpicked by our editors

Complimentary Access to The New York Times

  • News, Games, Cooking, Audio, Wirecutter & The Athletic

Business Standard Epaper

  • Digital replica of our daily newspaper — with options to read, save, and share

Curated Newsletters

  • Insights on markets, finance, politics, tech, and more delivered to your inbox

Market Analysis & Investment Insights

  • In-depth market analysis & insights with access to The Smart Investor

Archives

  • Repository of articles and publications dating back to 1997

Ad-free Reading

  • Uninterrupted reading experience with no advertisements

Seamless Access Across All Devices

  • Access Business Standard across devices — mobile, tablet, or PC, via web or app

Topics :Chart ReadingBuzzing stocksStocks callsStocks in focustechnical analysisstocks technical analysis

Next Story