The Sushi Roll pattern is used to identify major reversals in the stock markets. This pattern involves a study of 10 candles to deeply understand the shift in the market sentiment. The first five candles show a sideways movement, without any major oscillations, and the remaining five candles engulf the highs and lows of these first five candles. The formation may show either bullish or bearish signals, and depicts the overall mood of the traders and investors.
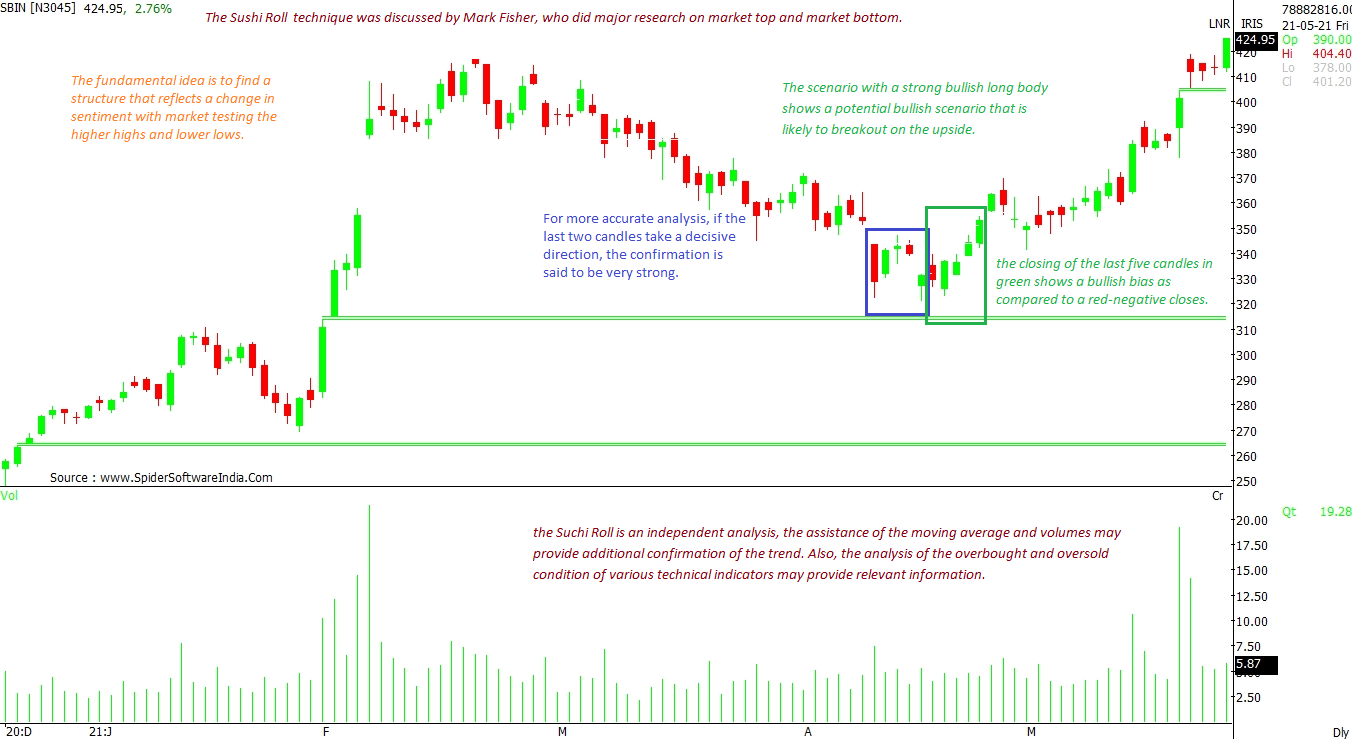
The closing of the last five candles in green shows a bullish bias as compared to a red-negative closes. A bearish bias implies negative closing in the last five candles. The strategy is to discover the breakout potential by evaluating the momentum in the candles. The technique was discussed by Mark Fisher, who did major research on market top and market bottom.
The basic idea is to find a structure that reflects a change in sentiment with market testing the higher highs and lower lows. This shows the loss of patience on the part of buyers or sellers and the likely shift in trend, which could be caused by several reasons like economic development, corporate announcements, global news, and so on.
Importance of Sushi Roll -- One of the early indicators to determine the reversal in trend.
-- Also acts as a parameter to exit positions on reversal signals
-- The various strategies assist traders and investors in taking informed decisions on going long or short
-- If Sushi Roll is recognized in advance, the gains could be very lucrative
-- The Sushi Roll can be applied on varied time frames like hourly, daily, weekly, monthly, etc
-- For more accurate analysis, if the last two candles take a decisive direction, the confirmation is said to be very strong.
Impact of Sushi Roll pattern Sushi roll pattern is based on the candlestick formation, where price plays a significant role. A situation with a strong bullish long body shows a potential bullish scenario that is likely to breakout on the upside.
The reversal pattern may observe a shift in sentiment and a beginning of a new trend. The firm confirmation of Sushi Roll has favorable effects on the larger outlook. The emergence of an upward breakout on the monthly/yearly chart totally changes the sentiment on the daily time frame.
The stop-loss in the bullish breakout stays at the lowest low and in the bearish sentiment, the highest among the engulfing candles.
Conclusion Though the Sushi Roll is an independent analysis, the assistance of the moving average and volumes may provide additional confirmation of the trend. Also, the analysis of the overbought and oversold condition of various technical indicators may provide relevant information.
It is very rare to find a Sushi Roll on the charts, but if well recognized, then the outcome favors the analysis. It is rare, but very confirmative and a pattern with little risk. (
State Bank of India chart)
 "How 10 candles in a chart pattern make a Sushi Roll")


