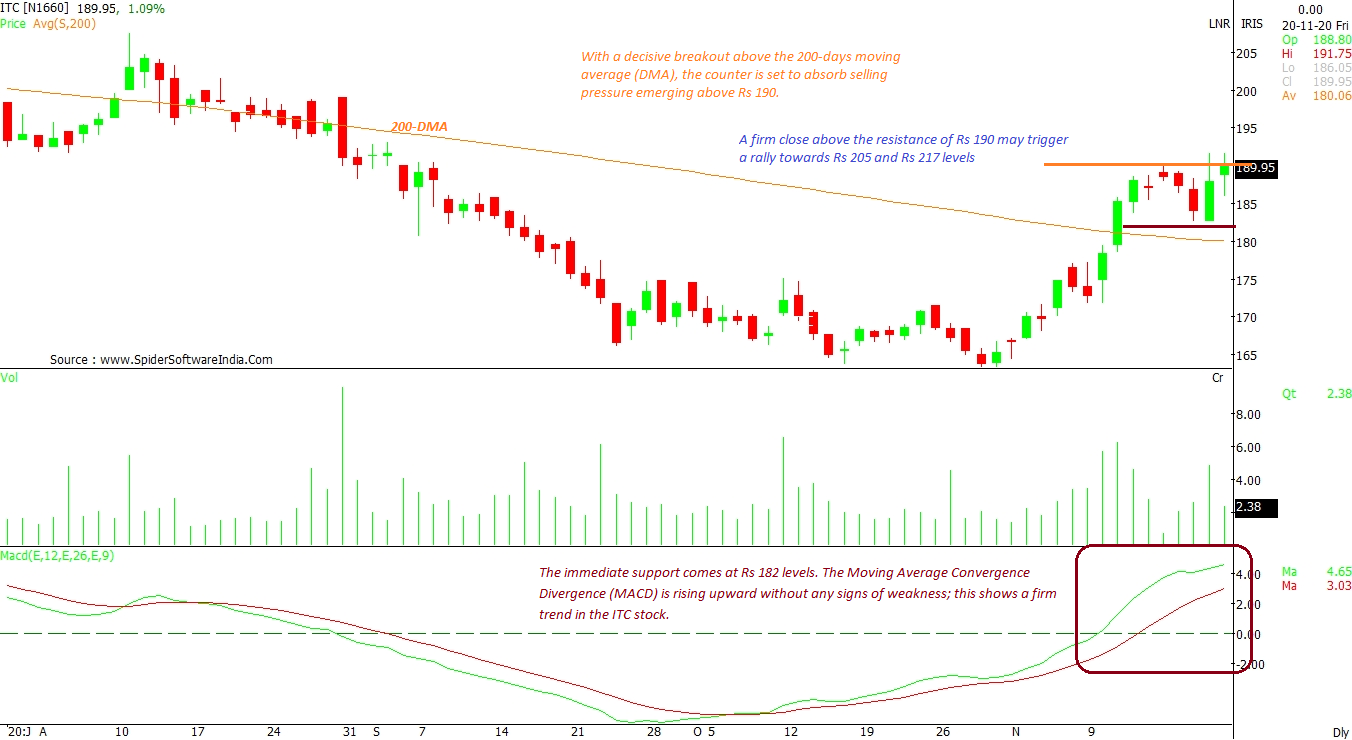
ITC Ltd (ITC): With a decisive breakout above the 200-day moving average (DMA), the counter is set to absorb selling pressure emerging above Rs 190. A firm close above the resistance of Rs 190 may trigger a rally towards Rs 205 and Rs 217 levels, as per the daily chart. The immediate support comes in at Rs 182 levels. The moving average convergence divergence (MACD) is rising upward without any signs of weakness; this shows a firm trend in the ITC stock.
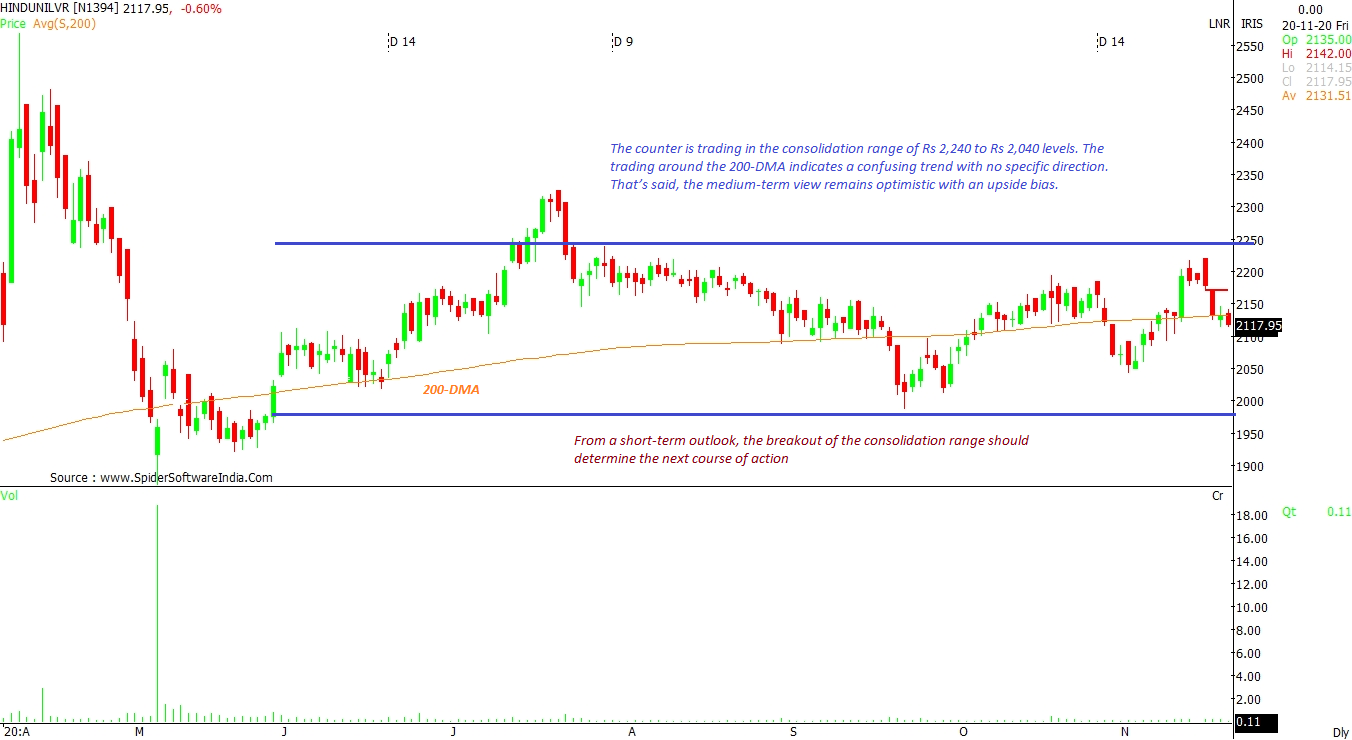
CLICK HERE FOR THE CHART Hindustan Unilever Ltd (HINDUNILVR): The counter is trading in the consolidation range of Rs 2,240 to Rs 2,040 levels. Trading around the 200-DMA indicates a confusing trend with no specific direction. That said, the medium-term view remains optimistic with an upside bias. From a short-term outlook, the breakout of the consolidation range should determine the next course of action, as per the daily chart.
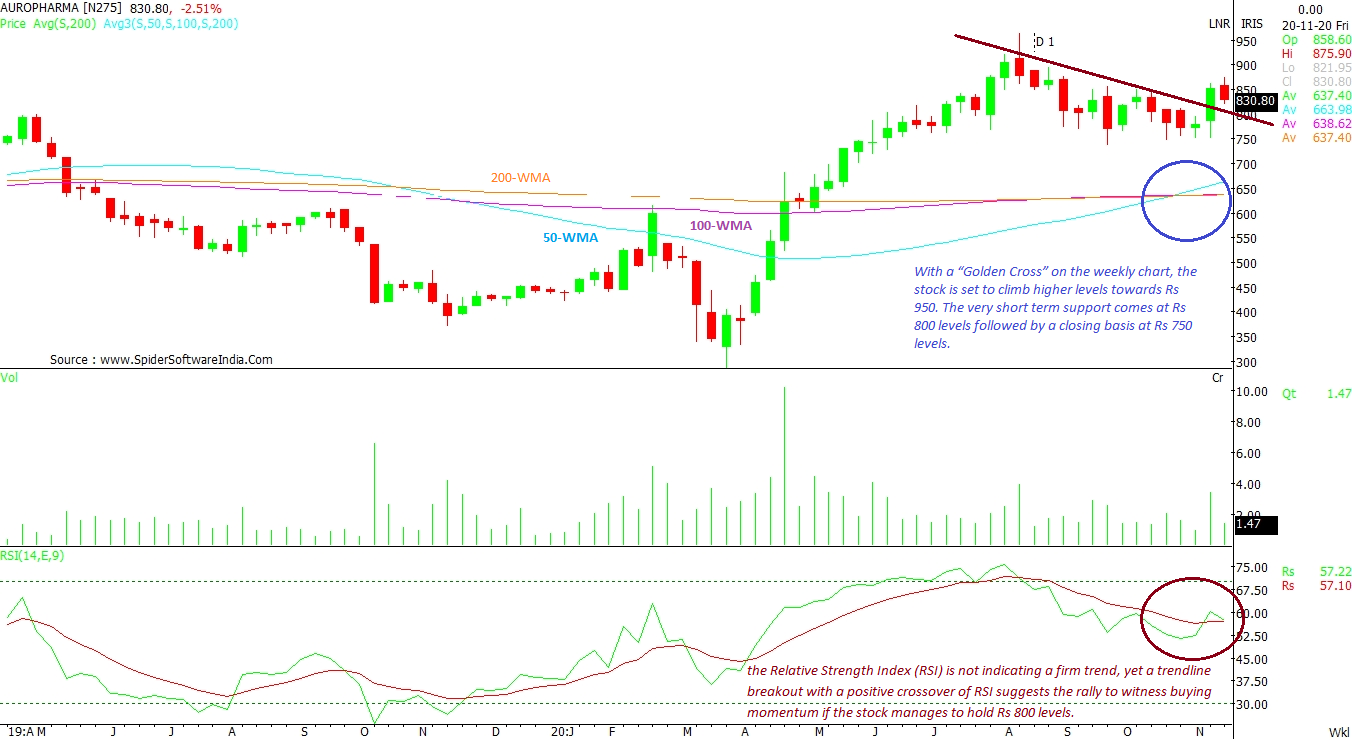
CLICK HERE FOR THE CHART Aurobindo Pharma (AUROPHARMA): With a “Golden Cross” formation on the weekly chart, the stock is set to climb higher levels towards Rs 950. The very short term support comes in at Rs 800 levels, followed by a closing basis at Rs 750 levels. Although the Relative Strength Index (RSI) is not indicating a firm trend, yet a trendline breakout with a positive crossover of RSI suggests the rally to witness buying momentum if the stock manages to hold Rs 800 levels.
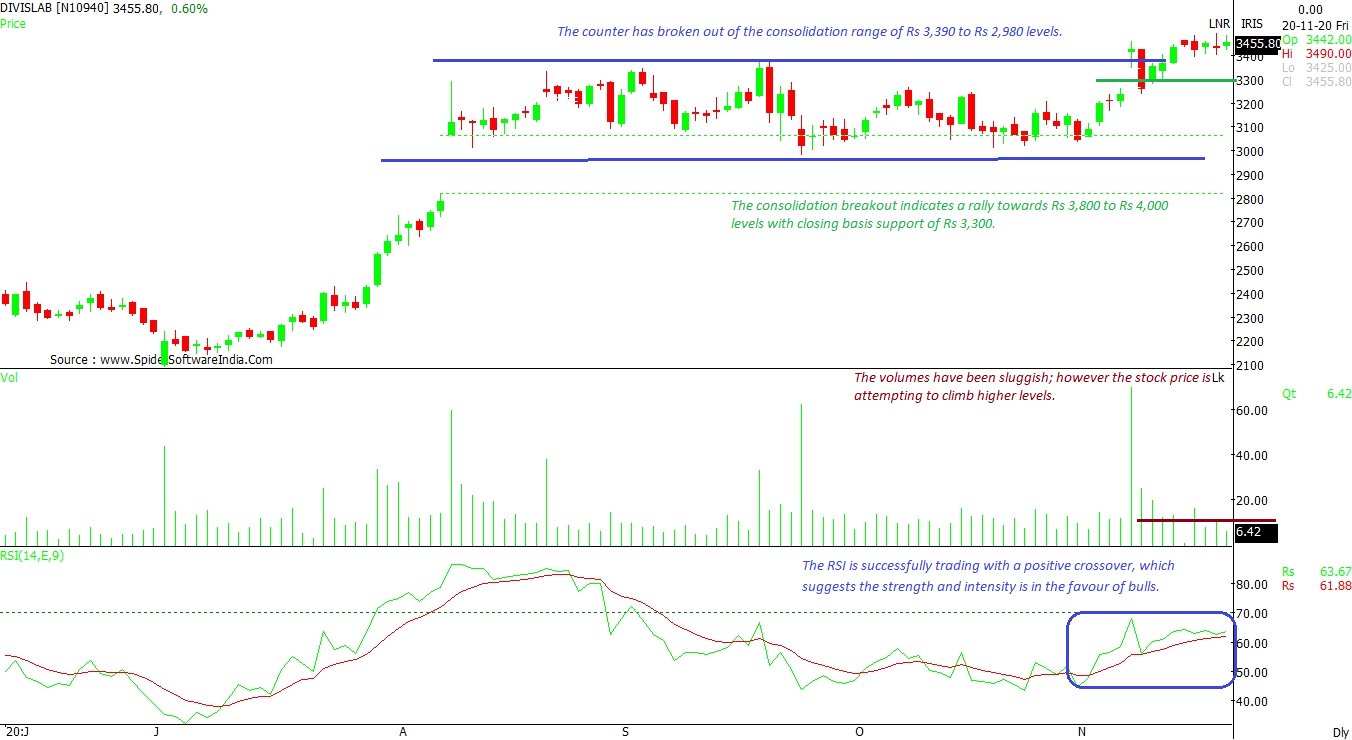
CLICK HERE FOR THE CHART Divi's Laboratories Ltd (DIVISLAB): The counter has broken out of the consolidation range of Rs 3,390 to Rs 2,980 levels. The volumes have been sluggish; however the stock price is attempting to climb higher levels. The consolidation breakout indicates a rally towards Rs 3,800 to Rs 4,000 levels with closing basis support of Rs 3,300. The RSI is successfully trading with a positive crossover, which suggests the strength and intensity is in the favour of bulls.
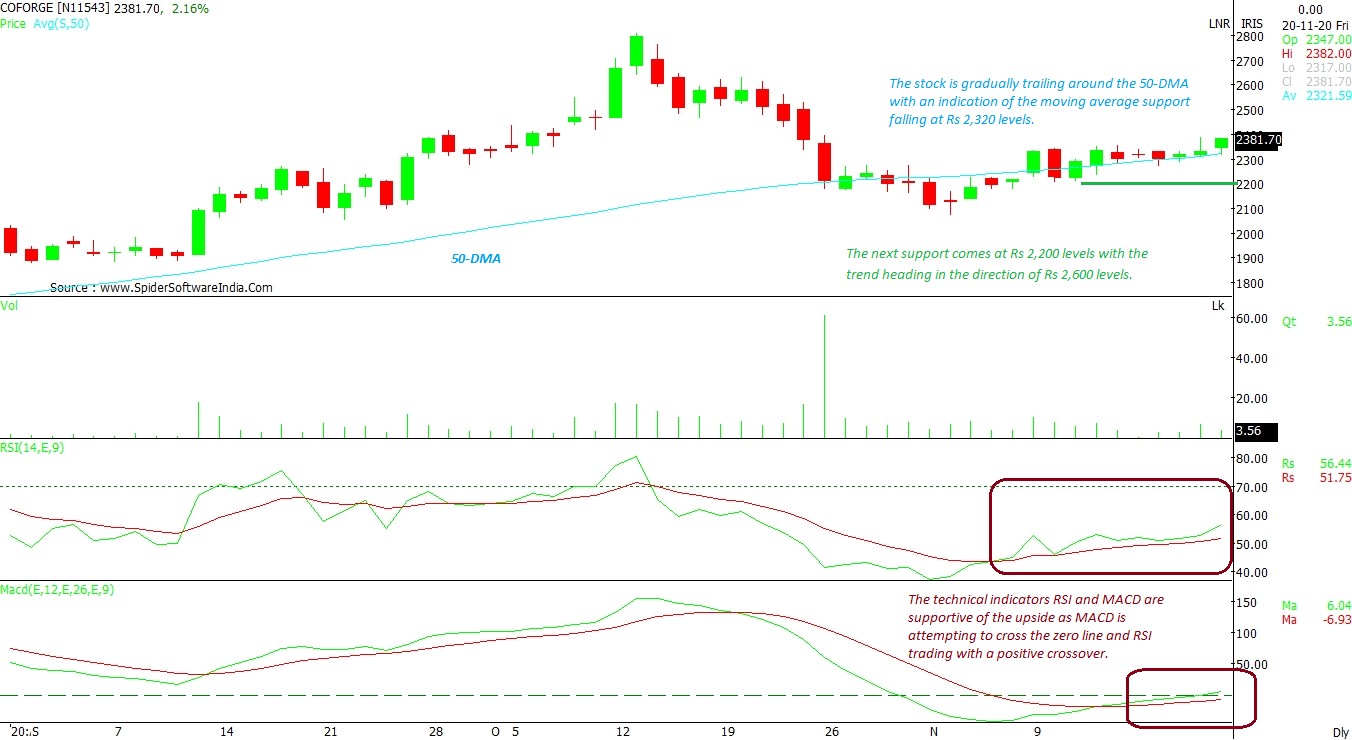
CLICK HERE FOR THE CHART Coforge Ltd (COFORGE): The stock is gradually trailing around the 50-DMA with an indication of the moving average support falling at Rs 2,320 levels. The technical indicators RSI and MACD are supportive of the upside as MACD is attempting to cross the zero line and RSI trading with a positive crossover. The next support comes in at Rs 2,200 levels with the trend heading in the direction of Rs 2,600 and Rs 2,800 levels.
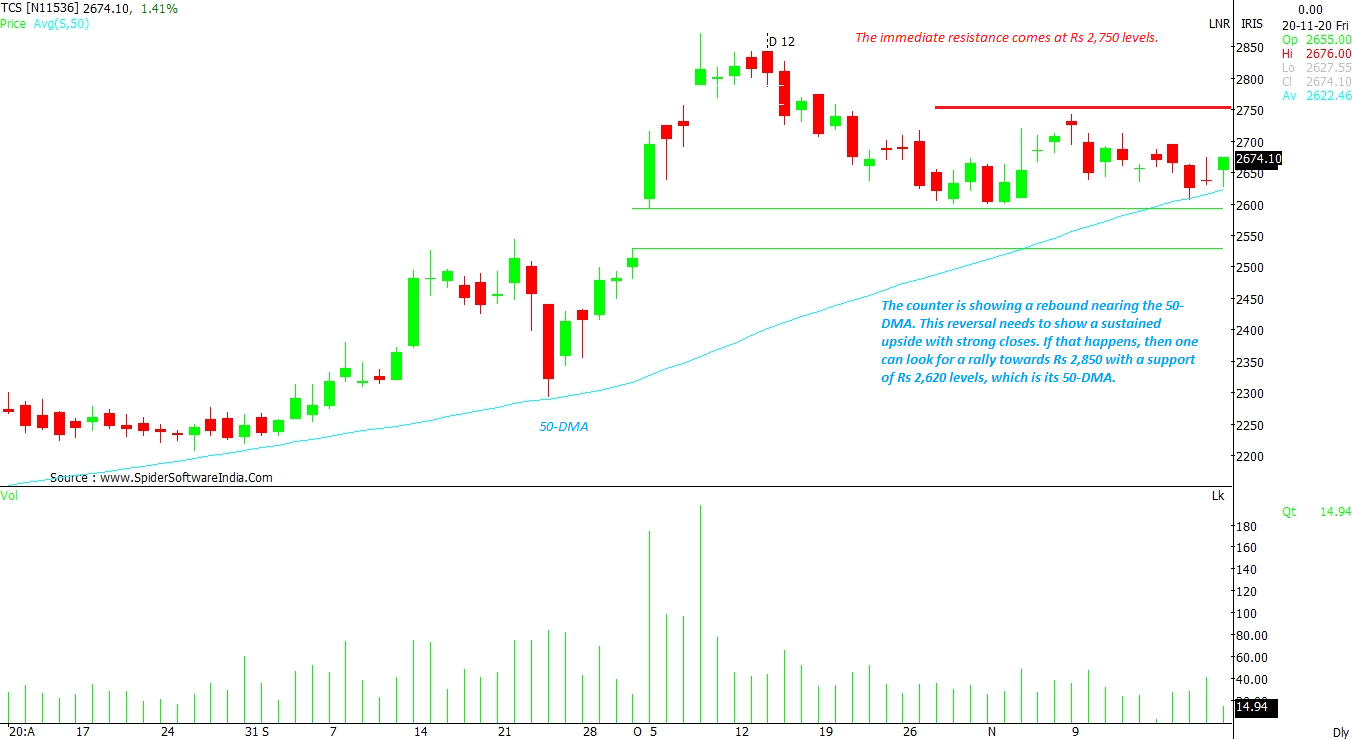
CLICK HERE FOR THE CHART  "ITC, TCS: Trading strategies for defensive stocks in a volatile session")


