Brent Crude fell over two per cent to $57.04 per barrel on Monday, as the rapid spread of the coronavirus in several countries outside China left investors fretting about a hit to demand. Back home, equity benchmark indices opened lower with a cut of 1 per cent. The overall sentiment may lose the positive grip if the trend continues on weaker side. However, the paint companies are showing decent upside over the last few sessions and may continue to do so.
Here’s how to trade Paint stocks -
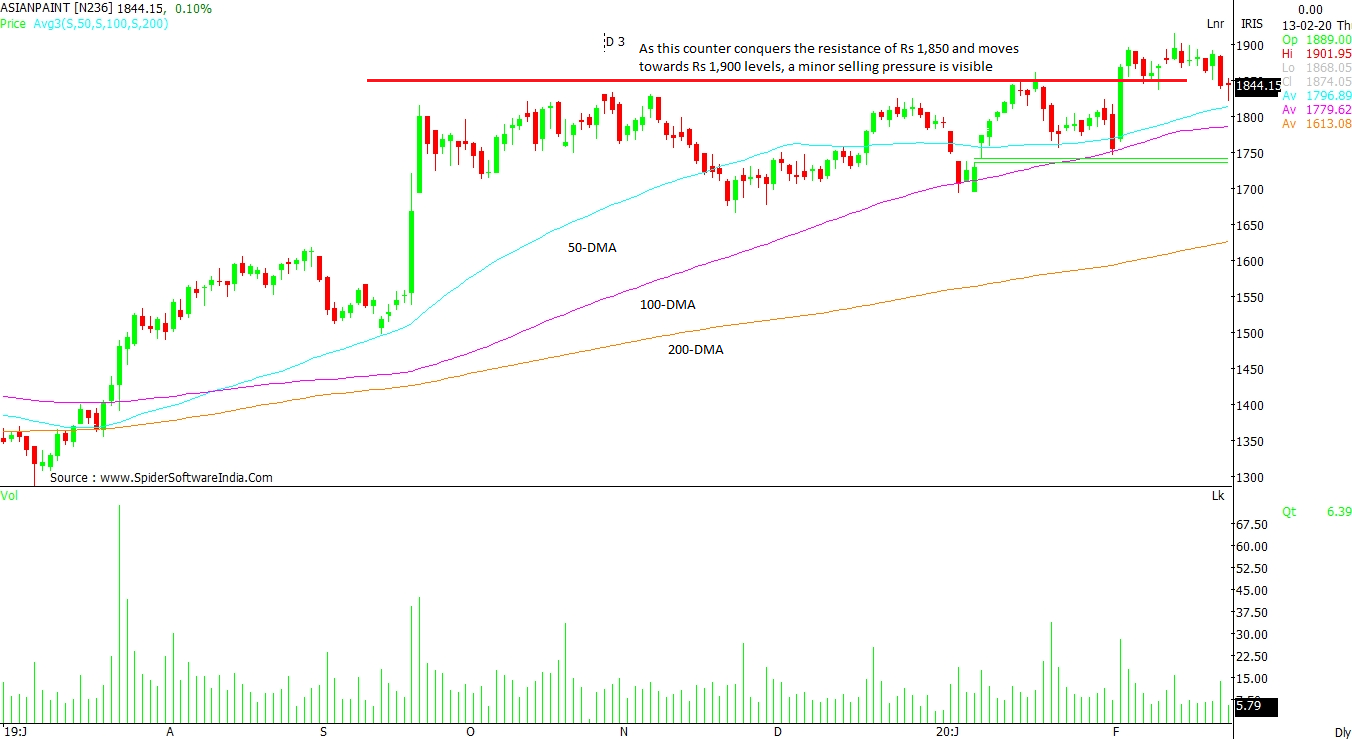
ASIAN PAINTS LTD (ASIANPAINT): As this counter has conquered the resistance of Rs 1,850 and moved towards Rs 1,900 levels, a minor selling pressure is witnessed. However, the trend remains positive and the crossing of resistance should result in a positive upside towards Rs 1,960 levels in the coming sessions. The immediate support comes at 50-day moving average (DMA) and 100 DMA located at Rs 1,813 and Rs 1,785 levels, respectively. CLICK HERE FOR THE CHART
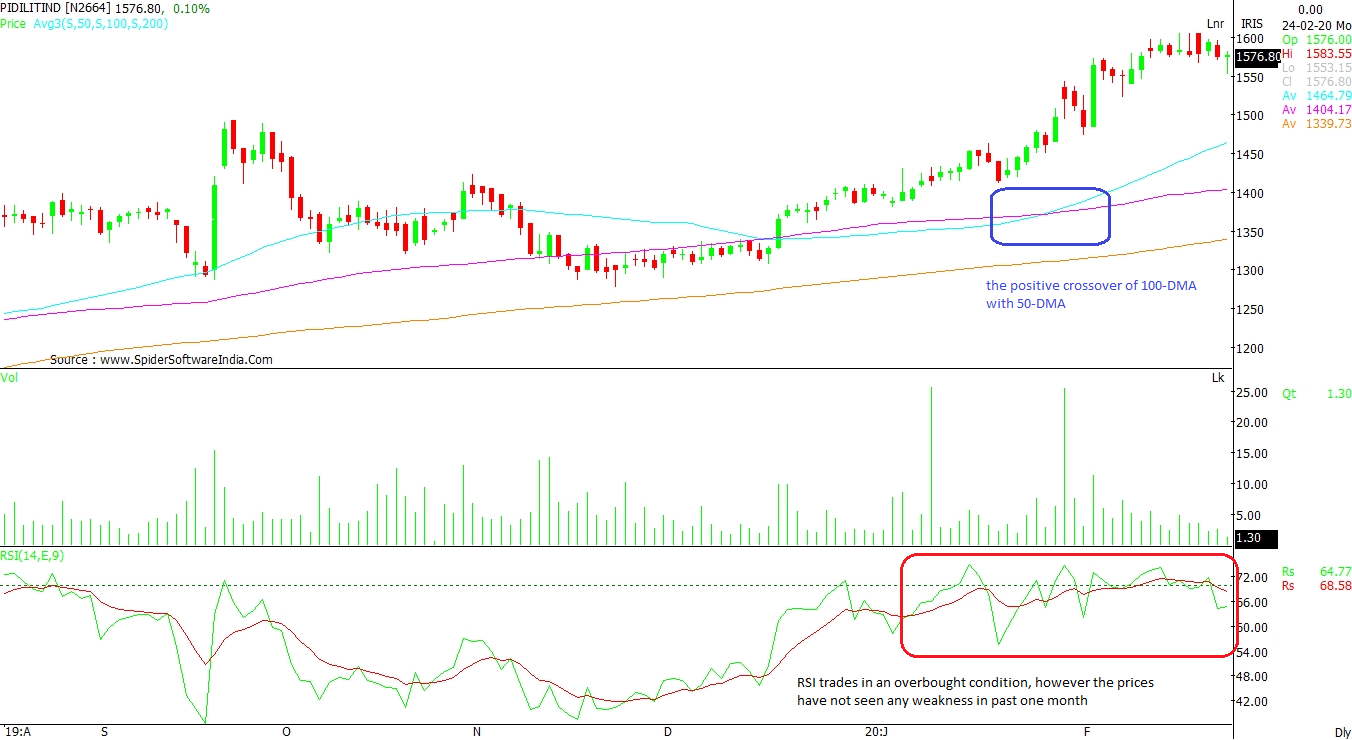
PIDILITE INDUSTRIES LTD (PIDILITIND): The formation of “Higher High, Higher Low” should result in an upside rally in the coming sessions. This coincides with the positive crossover of 100-DMA with 50-DMA at Rs 1,500 levels, as per the daily chart. The Relative Strength Index (RSI) index trades in an overbought condition, but the prices have not seen any weakness in the last one month. CLICK HERE FOR THE CHART
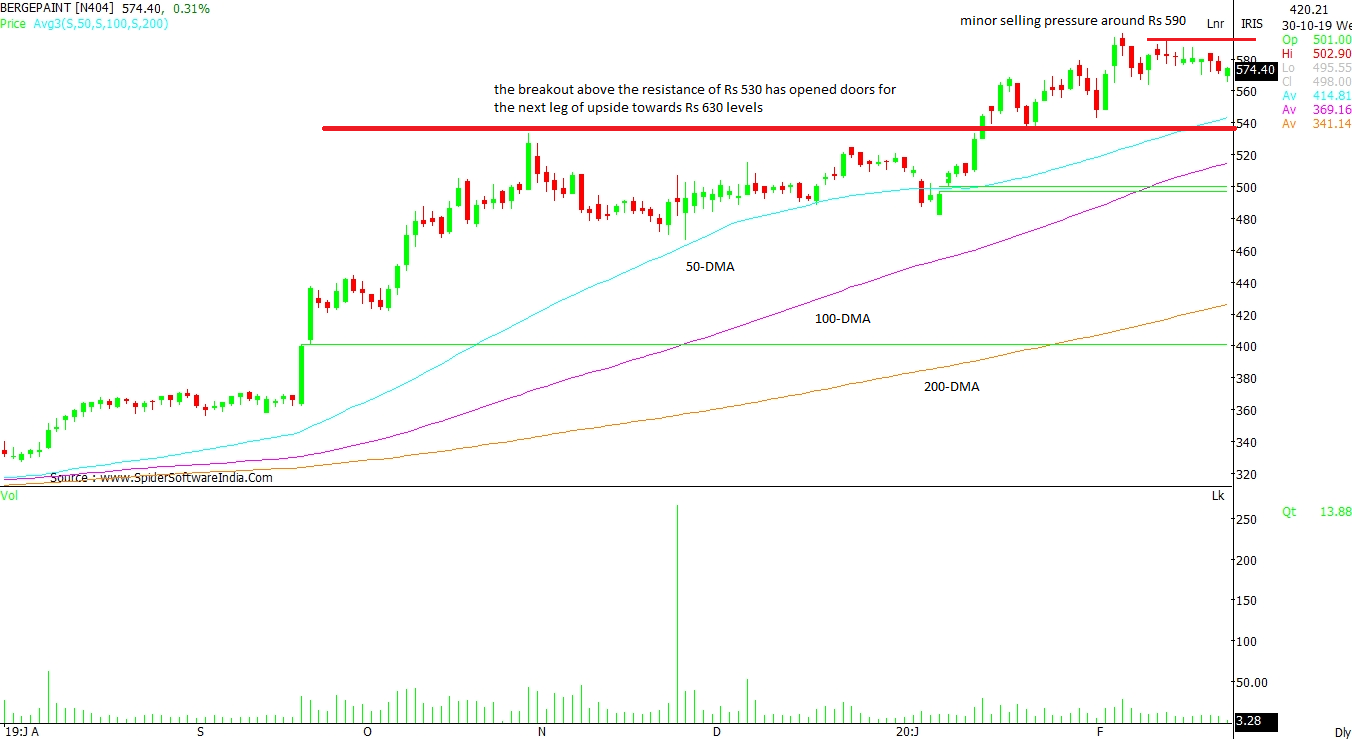
BERGER PAINTS INDIA (BERGEPAINT): The counter is not only trading above 200-DMA, but is defensively holding above 50-DMA placed at Rs 543 levels. Secondly, the breakout above the resistance of Rs 530 has opened doors for the next leg of upside towards Rs 630 levels. That said, a minor selling pressure can be seen around Rs 590 and it may eventually find support around Rs 565 - Rs 555 levels. CLICK HERE FOR THE CHART
Read this article for free
Register to continue reading premium journalism and analysis from Business Standard.
 "Chart Check: How to trade paint stocks amid decline in crude oil prices")


