Home / Markets / News / Realty, NBFC, Cement: Select stocks from these sectors set to rise over 10%
Realty, NBFC, Cement: Select stocks from these sectors set to rise over 10%
While the development is a step in the right direction as regards the real estate sector, non-bank fiannce companies (NBFCs) and the cement sector, too, will reap benefits, some experts say
Markets have given a thumbs-up to the government's move of infusing Rs 25,000 crore in the real estate sector via an alternate investment fund (DF) to complete the stalled projects. While the development is a step in the right direction as regards the real estate sector, non-bank fiannce companies (NBFCs) and the cement sector, too, will reap benefits, some experts say.
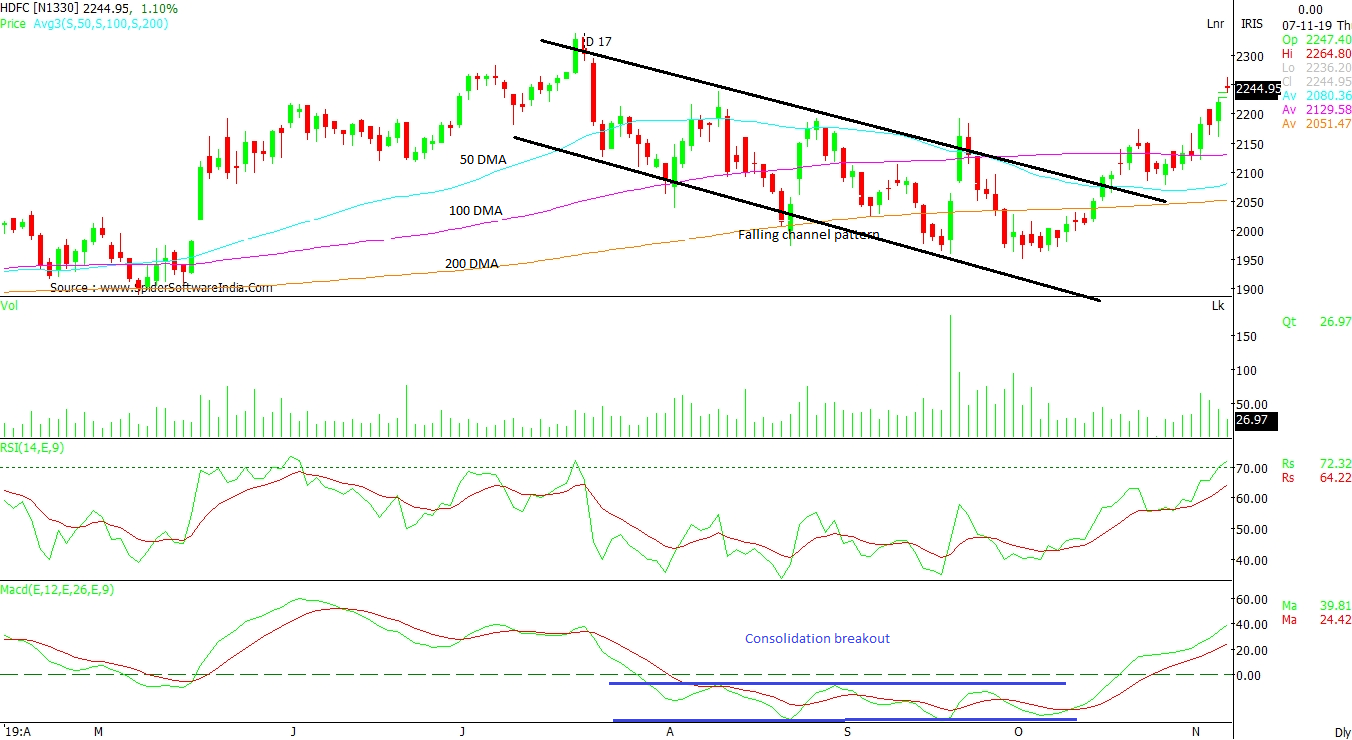
Housing Development Finance Corporation (HDFC): A decisive breakout of “Falling Channel pattern”, as per daily chart has led to an upside, which should see the counter scale beyond the peak of Rs 2,341. As Relative Strength Index (RSI) has entered the overbought region, a small correction may even see buying opportunities. The 100-day moving average (DMA) placed at Rs 2,129 levels remains a support, followed by Rs 2,200 on a closing basis. Moving Average Convergence Divergence (MACD), which trades above signal line with a positive crossover, has actually broken out of two month consolidation, which also a positive sign. CLICK HERE FOR THE CHART
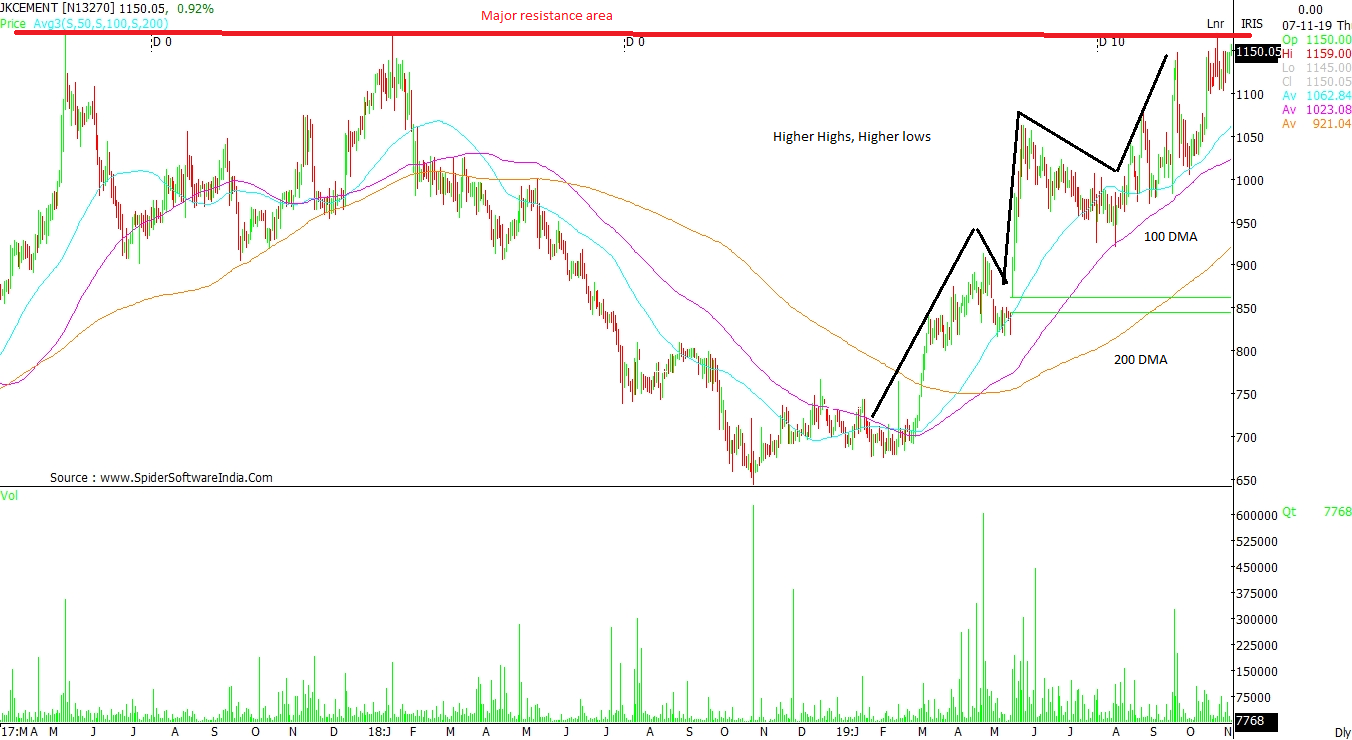
JK Cement Ltd (JKCEMENT): The stock has surged 65 per cent from Feburary 2019. At the current levels, Rs 1,150 is becoming a hurdle. The stock had faced a stiff resistance in this zone in 2017 and 2018 as well. The current formation suggests “Higher Highs, Higher lows”, and till the counter trades above Rs 1,000, one can expect a breakout above Rs 1,200. In that scenario, the rally should take the stock towards Rs 1,310 and then Rs 1,360 levels. It trades well above its 100-and 200-DMAs, placed at Rs 1,023 and Rs 921, respectively. CLICK HERE FOR THE CHART
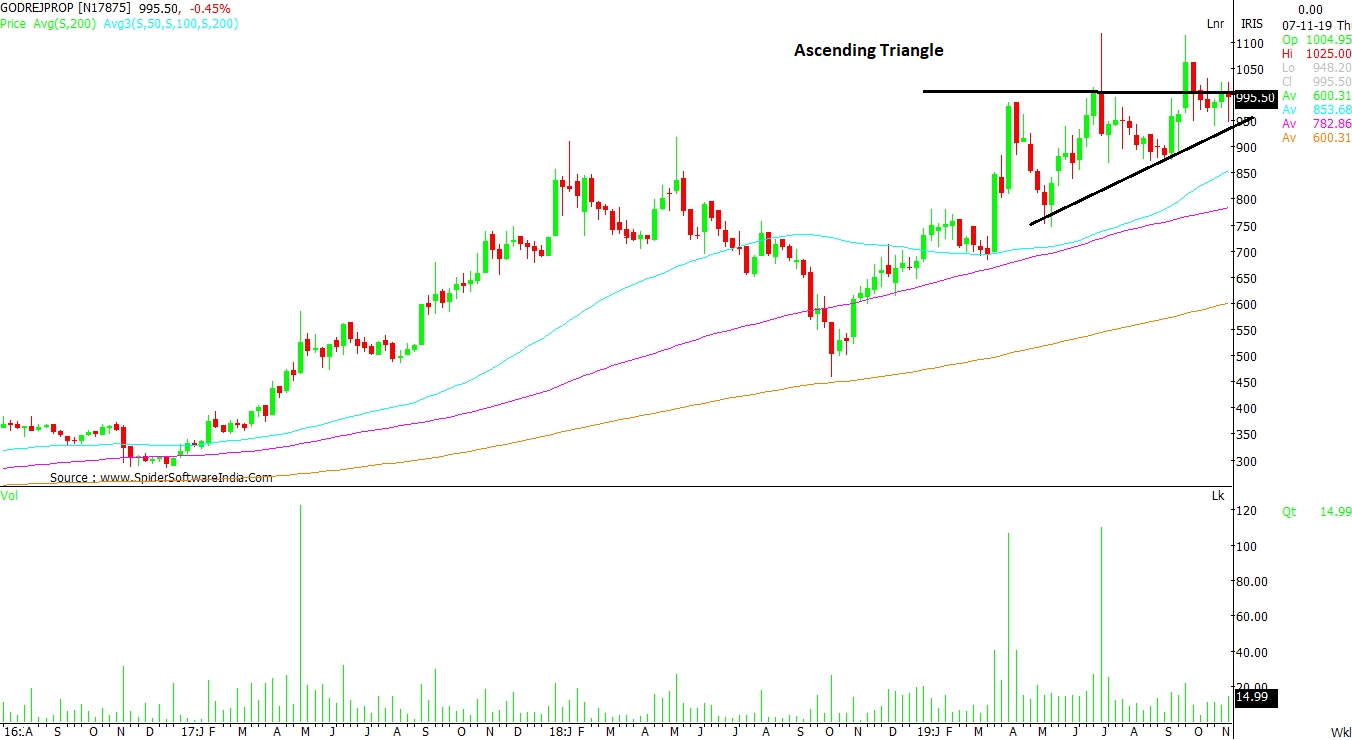
Godrej Properties Ltd (GODREJPROP): This counter has broken out of “ascending triangle” when seen on closing basis on the weekly chart. In the last seven months, Godrej Properties has seen a correction after a steep rise. The fall was used as a buying opportunity by investors, suggests the daily chart pattern. The range of Rs 850 –Rs 900 remains a support with resistance emerging above Rs 1,100. CLICK HERE FOR THE CHART
Read this article for free
Register to continue reading premium journalism and analysis from Business Standard.
 "Realty, NBFC, Cement: Select stocks from these sectors set to rise over 10%")


