Shares of metal companies have been on a run since the past few sesions. The Nifty Metal index surged around 2.5 per cent and was the top sectoral gainer on the NSE on Thursday. However, profit booking at higher levels saw the index slip over 1.5 per cent in trade on Friday.
That said, there still are some stock-specific opportunities which you can capitalise on. Here are a few trading ideas.
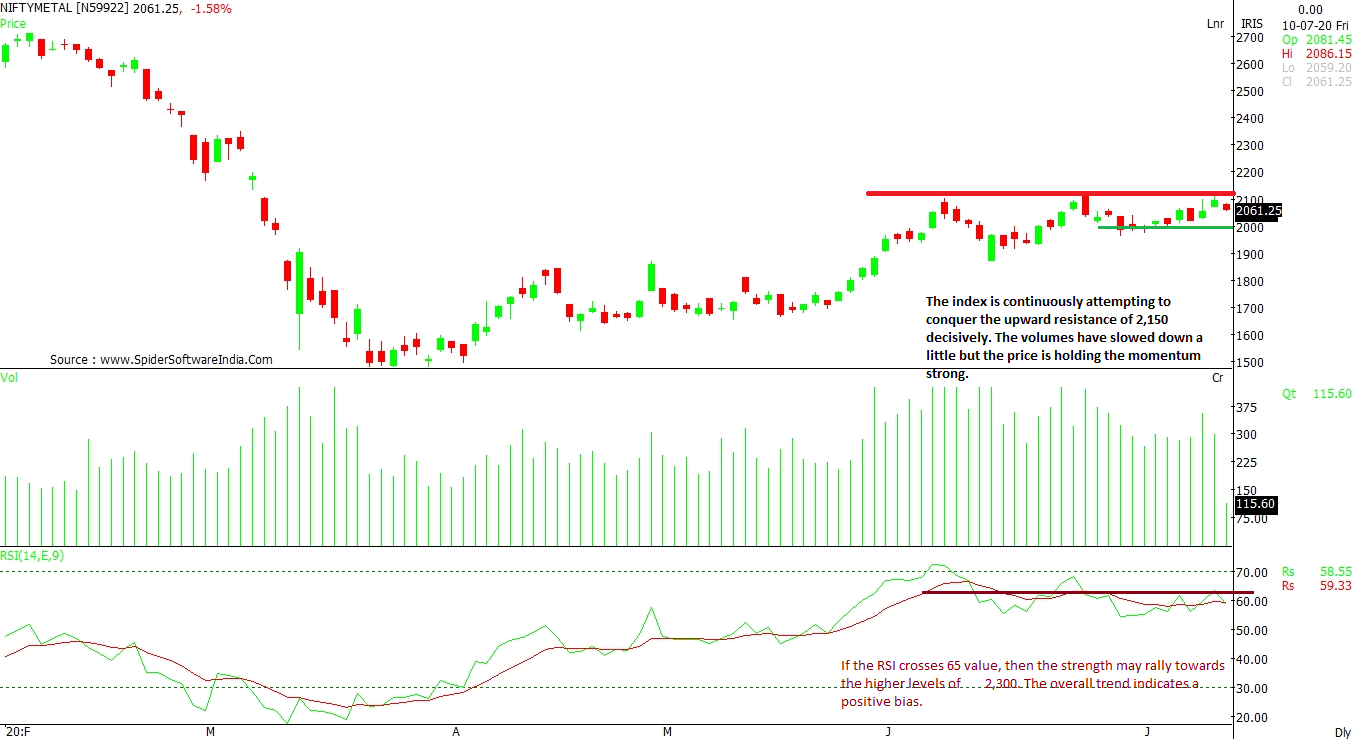
NIFTY METAL: The index is continuously attempting to conquer the upward resistance of 2,150 decisively. The volumes have slowed down a little, but the price is holding the momentum strong. The support remains at 2,000 levels. If the RSI crosses 65 mark, then the strength may see the index rally towards the 2,300 mark. The overall trend indicates a positive bias.
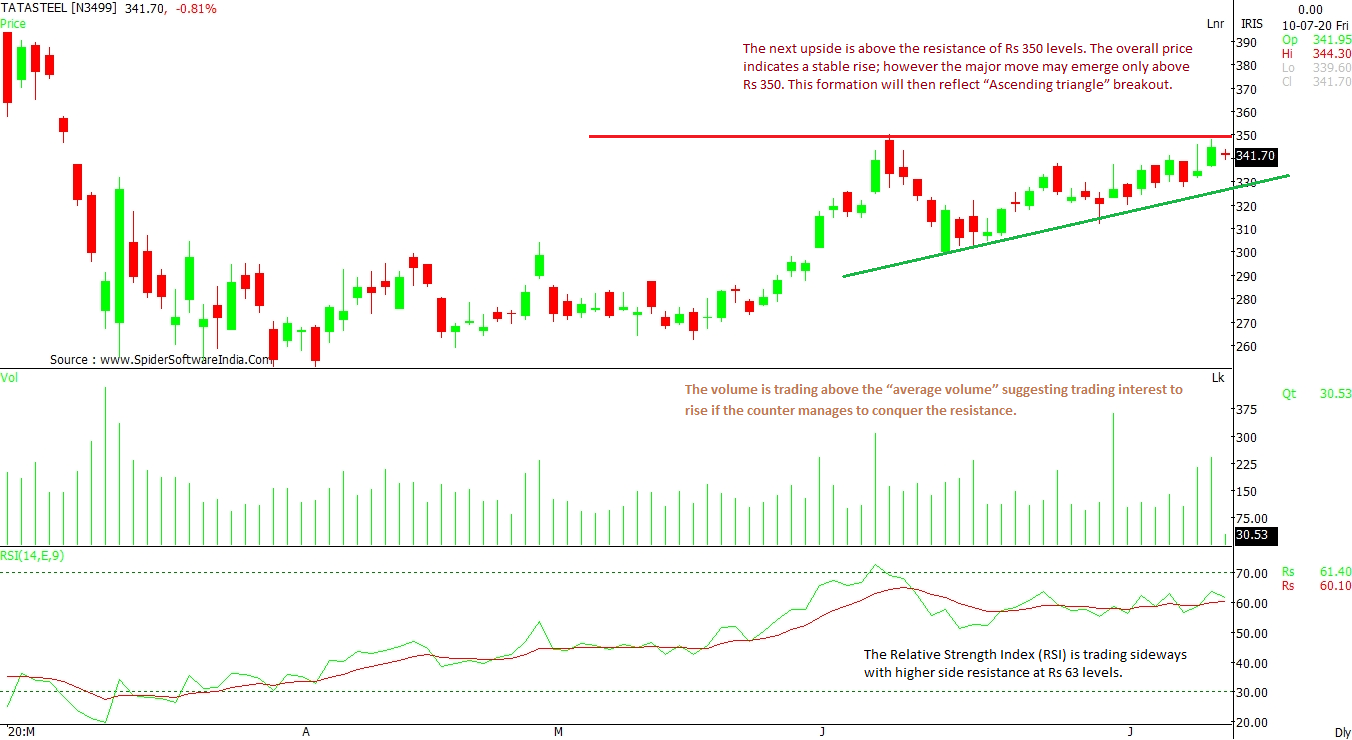
CLICK HERE FOR THE CHART Tata Steel Ltd (TATASTEEL): The next upside will emerge only when the stock can move above the resistance of Rs 350. For now, the overall price action indicates stability. A move above Rs 350 will reflect an “Ascending Triangle” breakout. The Relative Strength Index (RSI) is trading sideways with higher side resistance at Rs 63 levels. Volumes are above-average of the last few weeks, suggesting trading interest to be on the rise, which can shoot up even further once the resistance level is crossed.
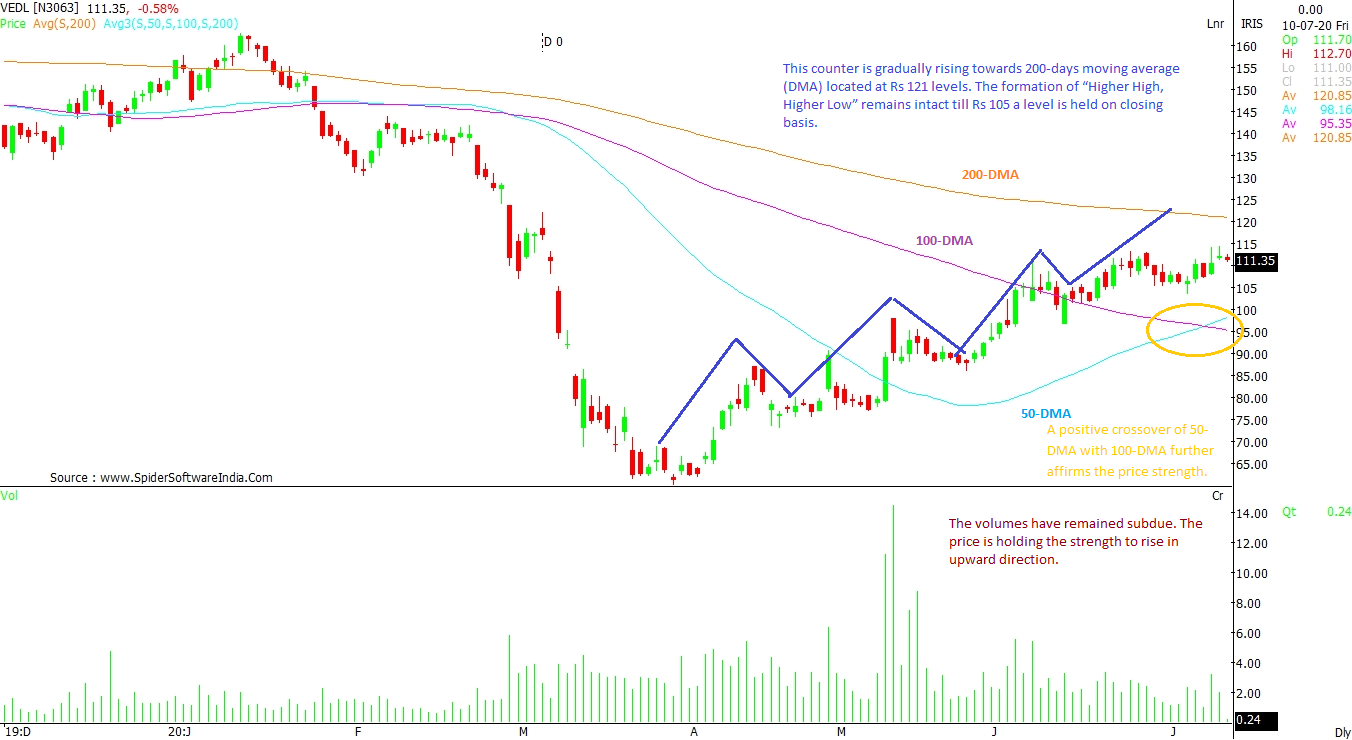
CLICK HERE FOR THE CHART Vedanta Ltd (VEDL): This counter is gradually rising towards 200-days moving average (DMA) located at Rs 121 levels. The formation of “Higher High, Higher Low” remains intact till Rs 105 a level is held on a closing basis. The volumes have remained subdued. The price is holding the strength to rise in upward direction. A positive crossover of 50-DMA with 100-DMA further affirms the belief that the stock can rise more from the current levels.
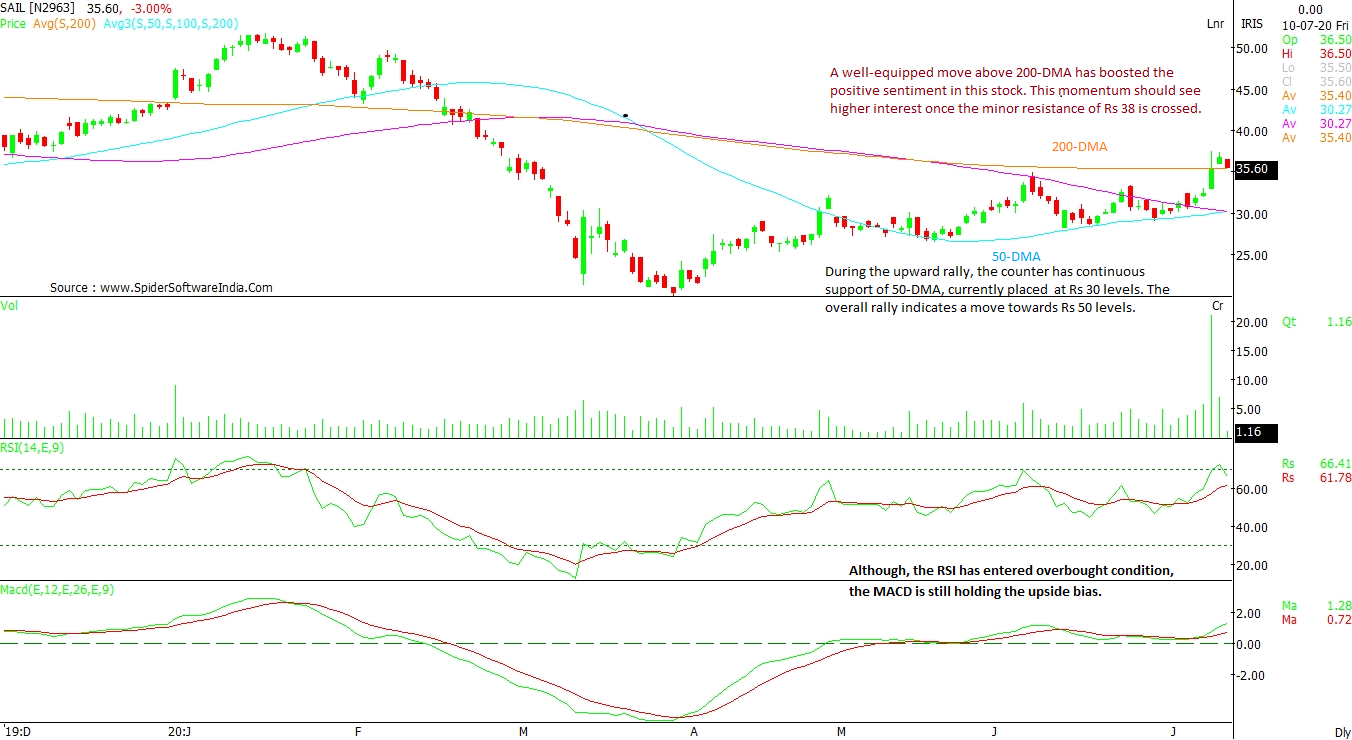
CLICK HERE FOR THE CHART Steel Authority of India Ltd (SAIL): A well move above 200-DMA has boosted the positive sentiment in this stock. This momentum should see get a further boost once the minor resistance of Rs 38 is crossed. During the upward rally, the counter has a continuous support of 50-DMA, which is currently placed at Rs 30 levels. The overall rally indicates a likely move towards Rs 50 levels. Although, the RSI has entered overbought condition, the MACD is still holding the upside bias.
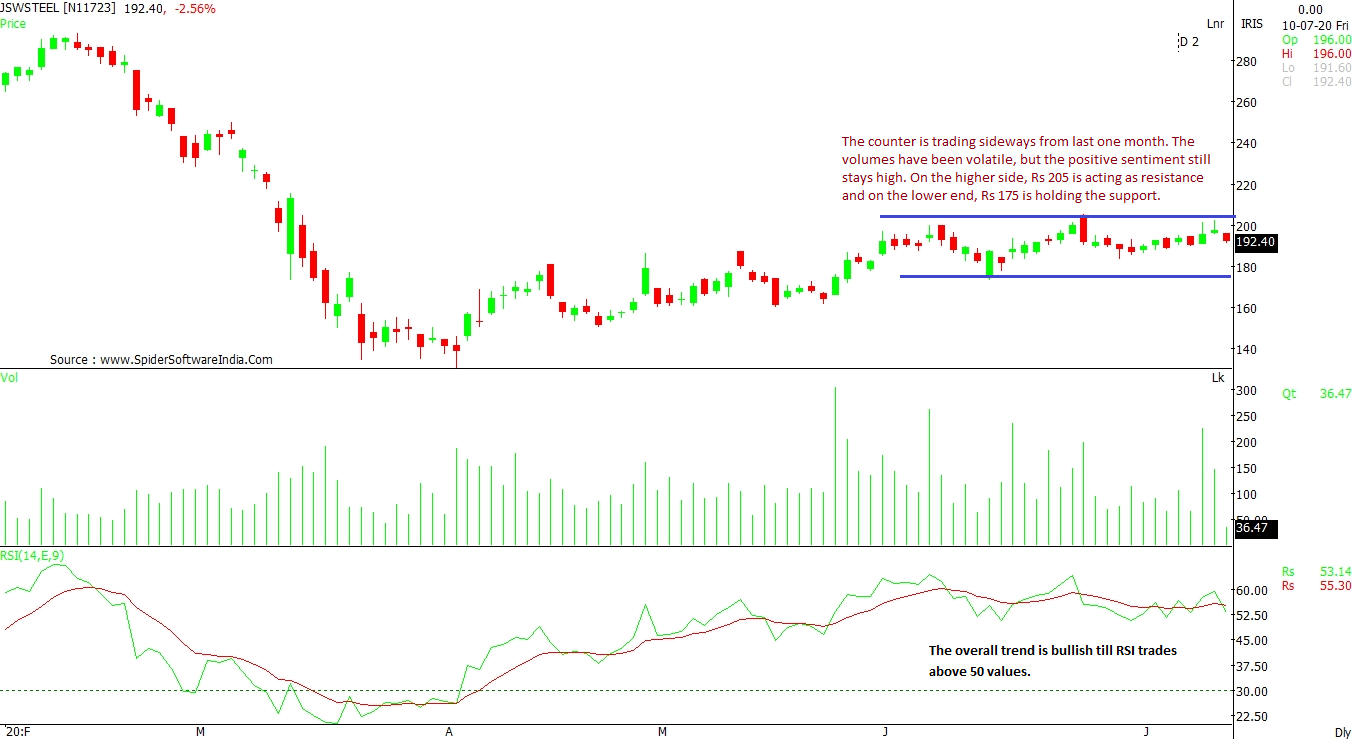
CLICK HERE FOR THE CHART JSW Steel Ltd (JSWSTEEL): The counter has been trading sideways since the last one month. The volumes have been volatile, but the positive sentiment is still intact. On the higher side, Rs 205 is acting as resistance and at the lower end, Rs 175 is holding the support. The overall trend is bullish till the RSI trades above 50 values.
CLICK HERE FOR THE CHART  "Metal stocks can outperform the market. Here are a few trading strategies")


