The stock market undergoes various phases that traders and investors analyse to maximize profits. The major phases are accumulation, growth (mark-up), and distribution phase. To analyse these phases, market participants majorly understand the volatility, thus reducing the risks involved. Average True Range (ATR) assists in recognizing the effect of volatility and helps to take advantage of unexpected movement. It is a technical indicator that measures market volatility.
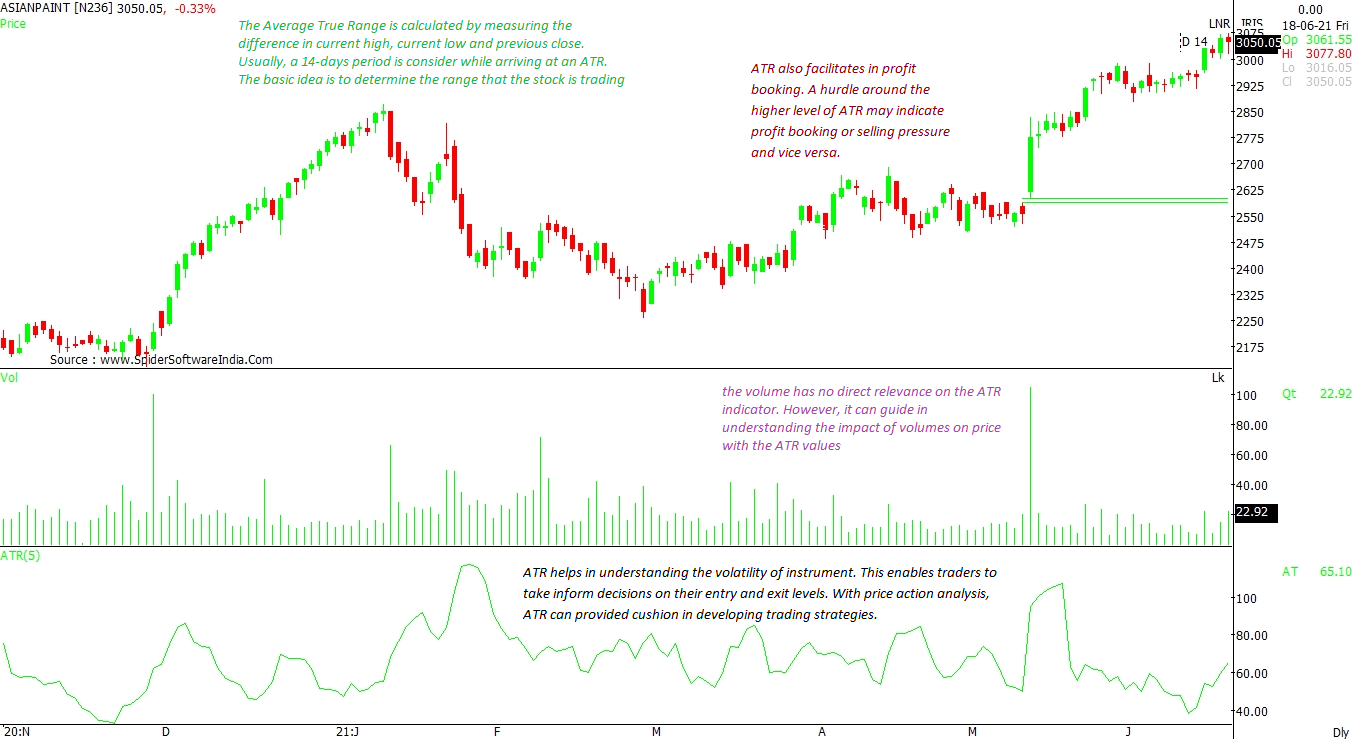
The Average True Range is calculated by measuring the difference in current high, current low, and the previous close. Usually, a 14-day period is considered while arriving at an ATR. The basic idea is to determine the range that the stock is trading. Anything beyond the range may be termed as breakout/ breakdown. When the momentum is strong, the ATR is expected to have a large value as compared to a scenario of low momentum.
Intraday players majorly rely on delivering higher returns with low risk. The minimum return should be double the risk involved. ATR facilitates in identifying such stocks by studying the entry and exit levels, and also provides information on the risks involved. It is key to knowing the range in which the stock is going to trade so that one can have a basic idea of maximum risk and profit.
Features of Average True Range -- It acknowledges market volatility and relevance of the price action
-- Short-term traders feel secure with the range/volatility indicator providing absolute levels.
-- ATR breakout can provide quick gains. When the price moves beyond the ATR levels, the trend is said to have broken out.
-- ATR can be also used in long-term investment.
-- ATR also facilitates profit booking. A hurdle around the higher level of ATR may indicate profit booking or selling pressure and vice versa.
-- It is a price based-indicator and any changes in price will have a major impact on the ATR values.
ATR cannot determine the strength and momentum of stocks. It is an instrument that focuses on volatility. Nevertheless, the movement of price has the same relevance as the strength in the price. When combined with strength and momentum oscillators like Relative Strength Index (RSI) or Moving Average Convergence Divergence (MACD), ATR can add value in understanding the possible surge in intraday or short-term positions.
Similarly, the volume has no direct impact on the ATR indicator. However, it can guide in understanding the impact of volumes on price with the ATR values. The price action needs to be driven by the strength and volumes for a better confirmation, but sometimes the price does show accelerated movement, as it reaches near the breakout ATR levels.
CHART OF ASIAN PAINTS LTD Conclusion ATR helps in understanding the volatility of the instrument. This enables traders to make informed decisions on their entry and exit levels. With price action analysis, ATR can provide a cushion in developing trading strategies.
 "Volatile markets? Use Average True Range indicator to minimize risk")


