In the backdrop of the on-going Russia-Ukraine war, global markets are worried about nuclear fallout, disruptions in several economic functions and rising commodity prices, which in turn call for immediate increase in interest rates. Though, markets are well aware of the Fed’s intention to do so, a quarter-point seems on card, whereas a half-point hike could surprise the market.
That apart, Russia and Ukraine produce a major component of semiconductor chips. Globally, 40 per cent of palladium, one of the resources, comes from Russia, while Ukraine supplies 70 per cent of neon worldwide.
The geopolitical event has hit the semiconductor production, inevitably creating short supply. This may worsen the industrial growth distressing the automobile, electronic and mobile sector.
Here’s an technical outlook on Automobile stocks amid the shortage of semiconductor chips:-
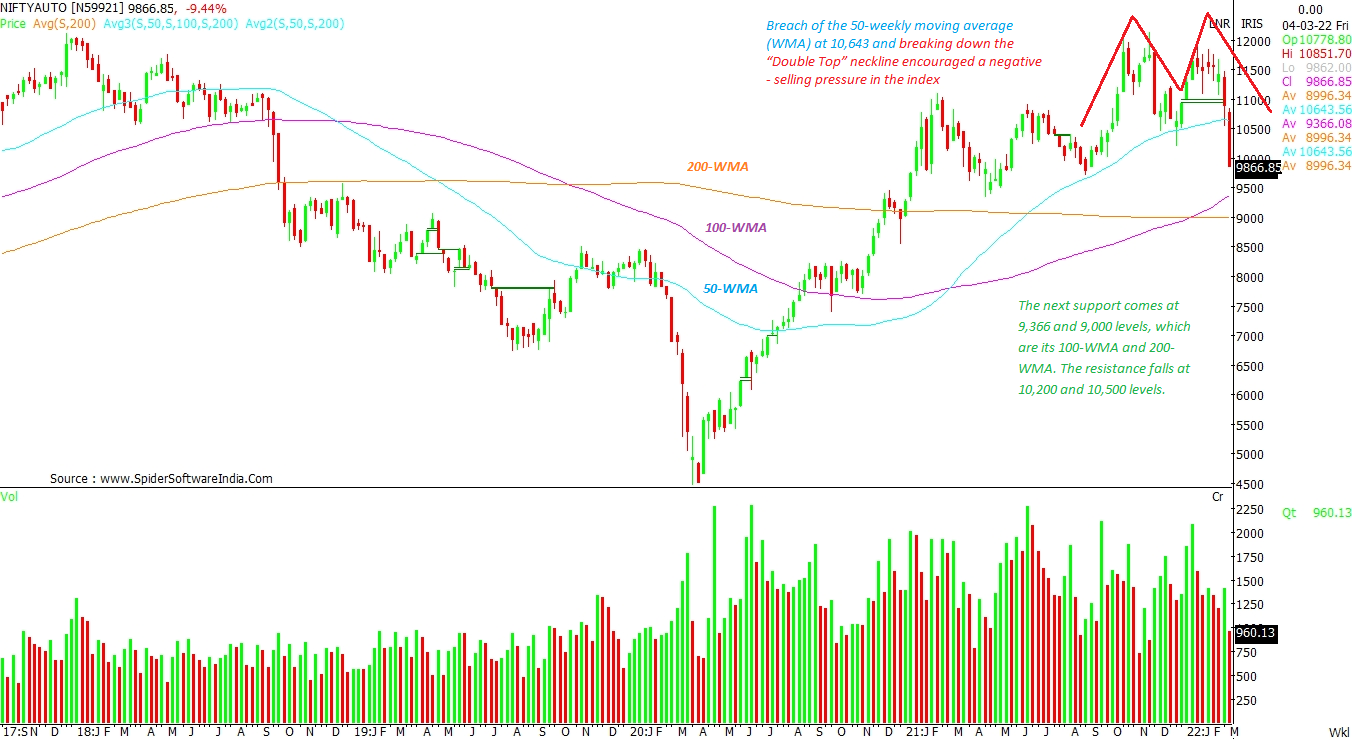
NIFTYAUTO
Likely target: 9,366
Downside potential: 5%
Breach of the 50-weekly moving average (WMA) at 10,643 and breaking down of the “Double Top” neckline at 10,500 has triggered a negative bias for the index, shows the weekly chart. The next support comes at 9,366 and 9,000 levels, which are its 100-WMA and 200-WMA. The resistance can be expected around 10,200 and 10,500 levels. CLICK HERE FOR THE CHART
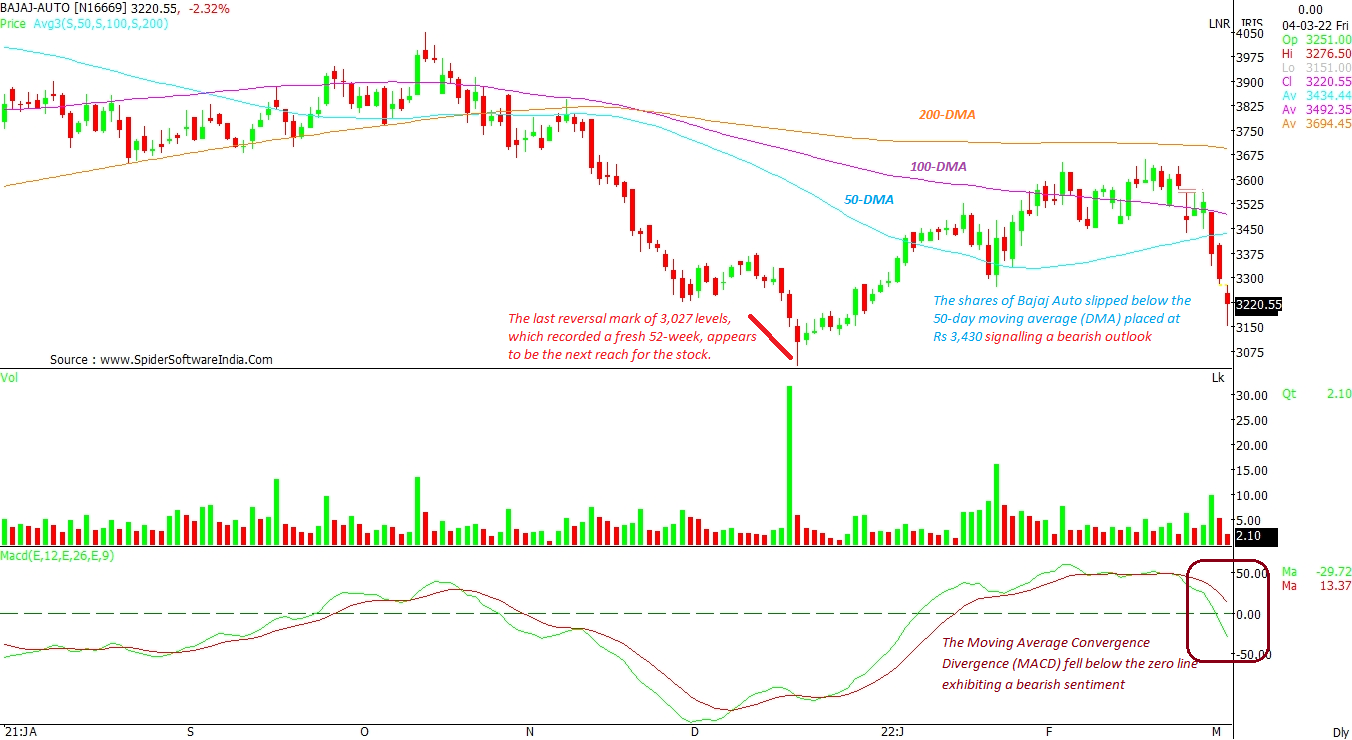
Bajaj Auto Ltd (BAJAJA-AUTO)
Likely target: Rs 3,027
Downside potential: 6%
The shares of Bajaj Auto slipped below the 50-day moving average (DMA) placed at Rs 3,430 signalling a bearish outlook, as per the daily chart. The last reversal mark of 3,027 levels, which recorded a fresh 52-week low, appears to be the next logical target for the stock. The Moving Average Convergence Divergence (MACD) has falled below the zero line and exhibiting a bearish sentiment, shows the daily chart. CLICK HERE FOR THE CHART
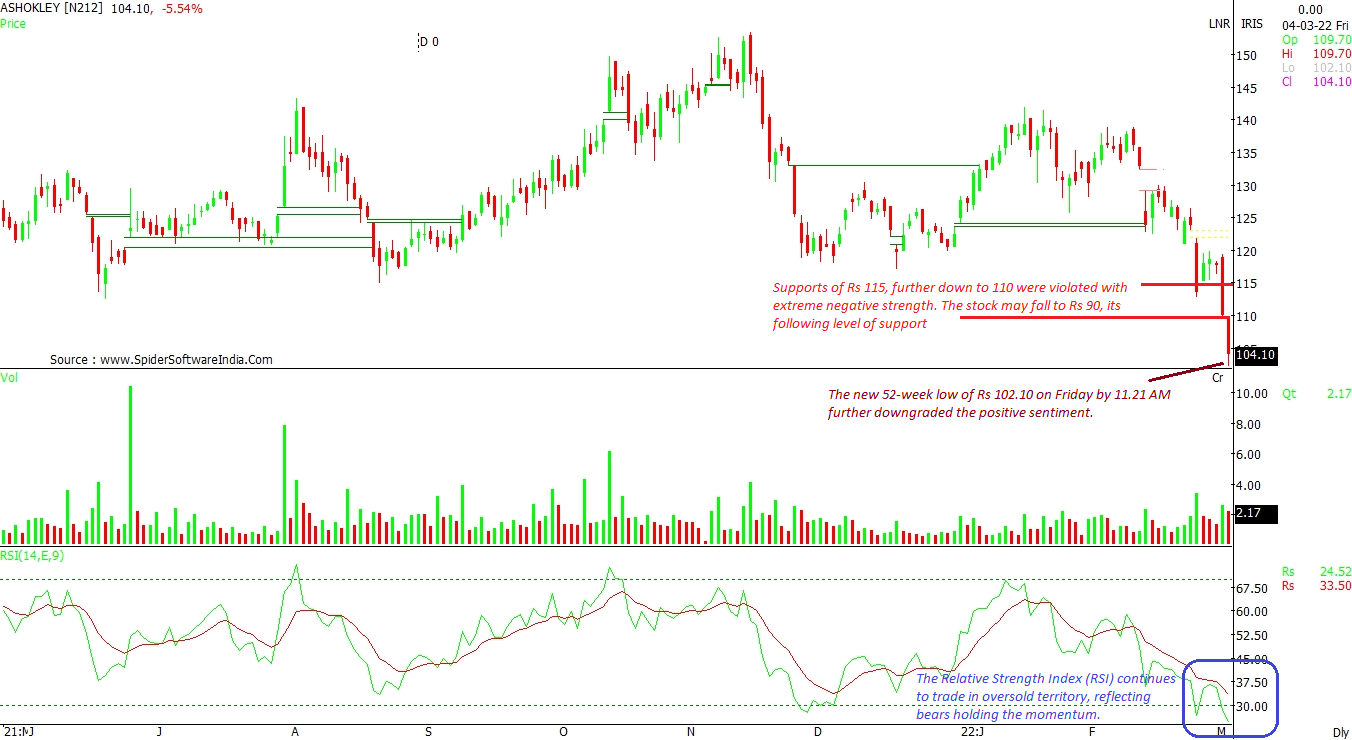
Ashok Leyland Ltd (ASHOKLEY)
Likely target: Rs 90
Downside potential: 12%
The stock hit a new 52-week low at Rs 102.10 on Friday as of 11:21 AM, and in the process has further dampened the positive sentiment. Key supports for the stock at Rs 115, and further down at Rs 110 were violated with extreme negative strength. The stock may now fall to Rs 90-odd levels, its following level of support, according to the daily chart set-up. The Relative Strength Index (RSI) continues to trade in an oversold territory, reflecting bears holding the momentum. CLICK HERE FOR THE CHART
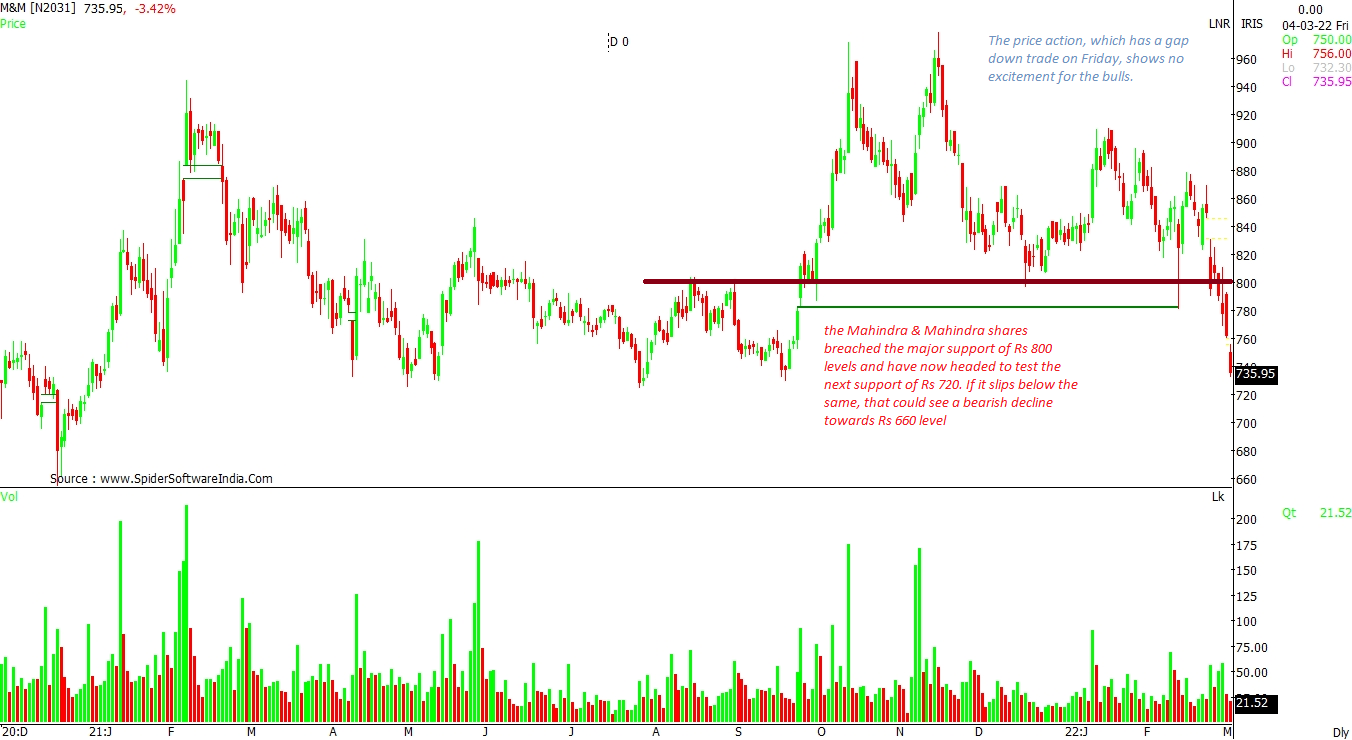
Mahindra & Mahindra Ltd (M&M)
Likely target: Rs 660 (below Rs 720)
Downside potential: 8.50%
Yes, the shares of Mahindra & Mahindra breached the major support of Rs 800-mark and now seem headed to test the next support at Rs 720. If the stock slips below the same, that could see a bearish decline towards Rs 660 level, as indicated on the daily chart. The price action, which has a gap down trade on Friday, shows no excitement for the bulls. CLICK HERE FOR THE CHART
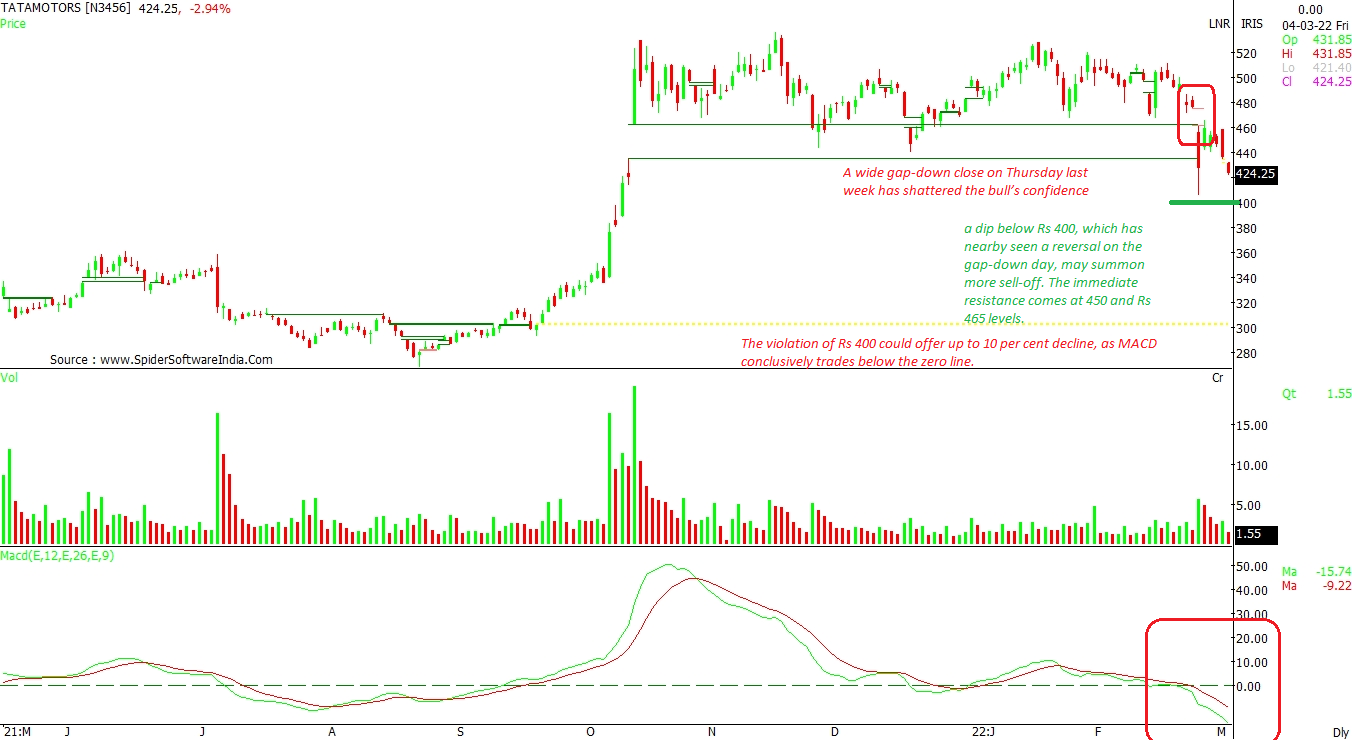
Tata Motors Ltd (TATAMOTORS)
Outlook: Needs to hang on Rs 400 level.
A wide gap-down close on Thursday last week has shattered the bull’s confidence. Hereon, a dip below Rs 400, which has nearby seen a reversal on the gap-down day, may summon more sell-off. The immediate resistance comes at 450 and Rs 465 levels. The violation of Rs 400 could offer up to 10 per cent decline, as MACD conclusively trades below the zero line. CLICK HERE FOR THE CHART
Read this article for free
Register to continue reading premium journalism and analysis from Business Standard.
 "War fallout! M&M, TaMo, Ashok Leyland can fall up to 12% on chip shortage")


