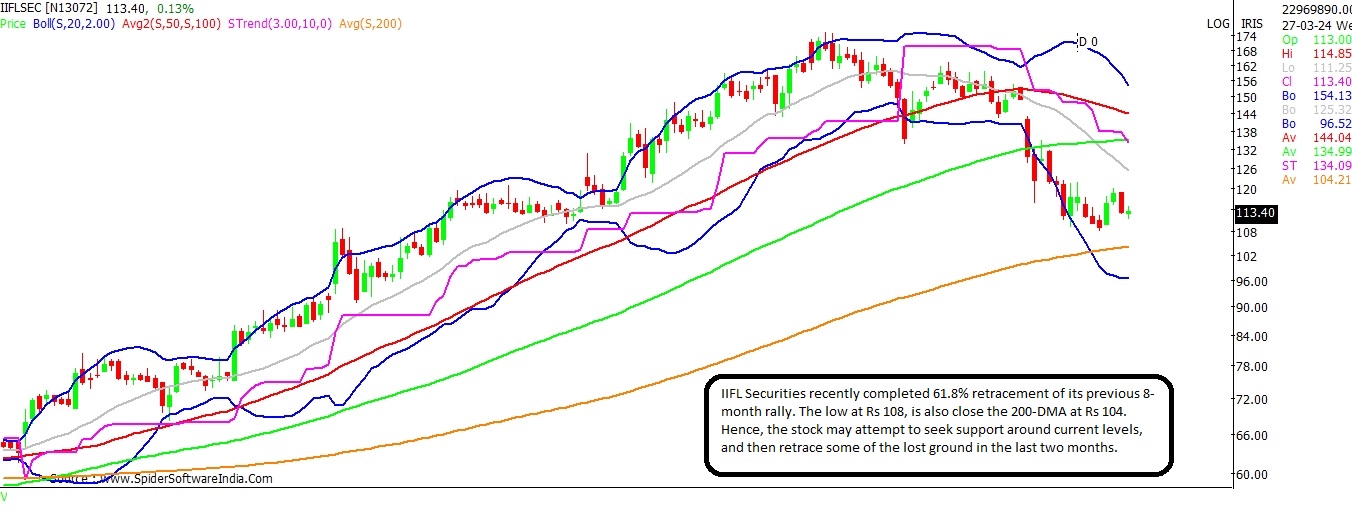
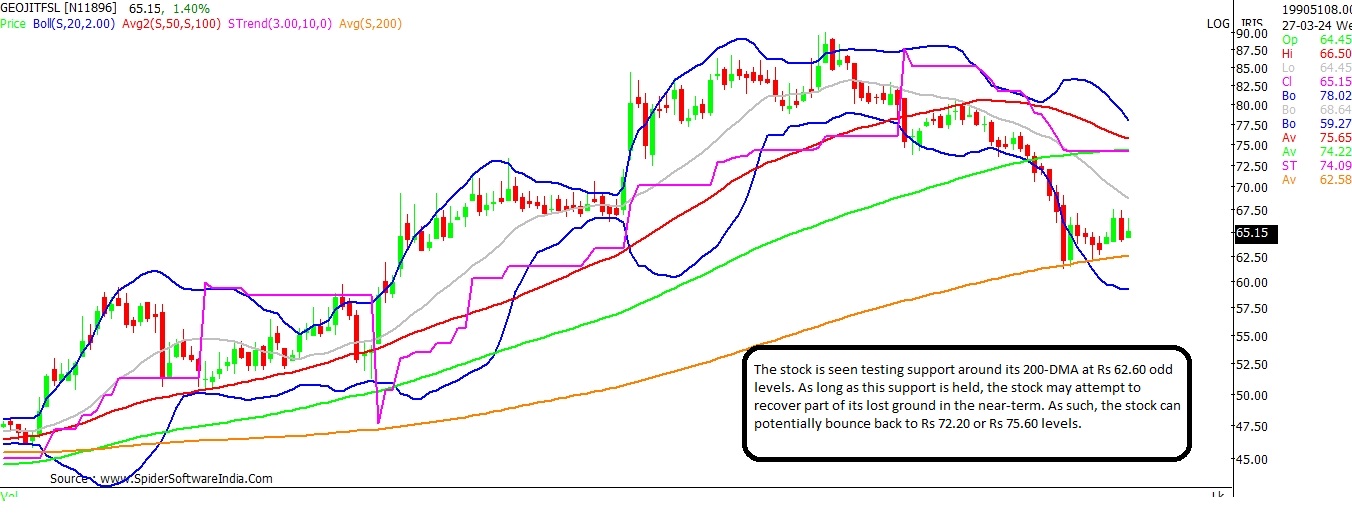
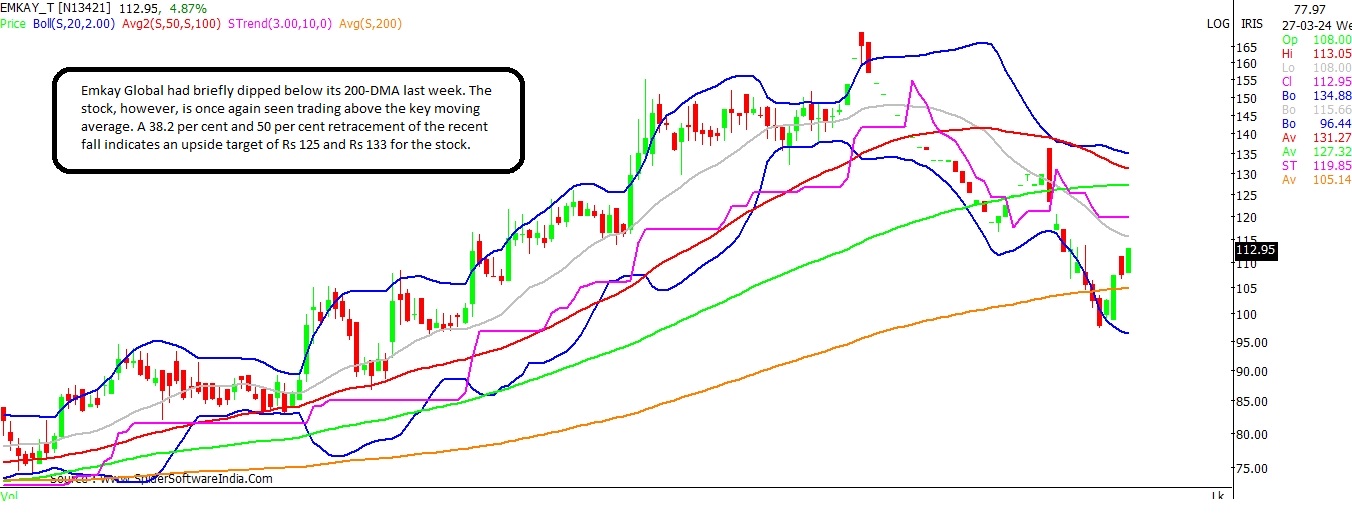
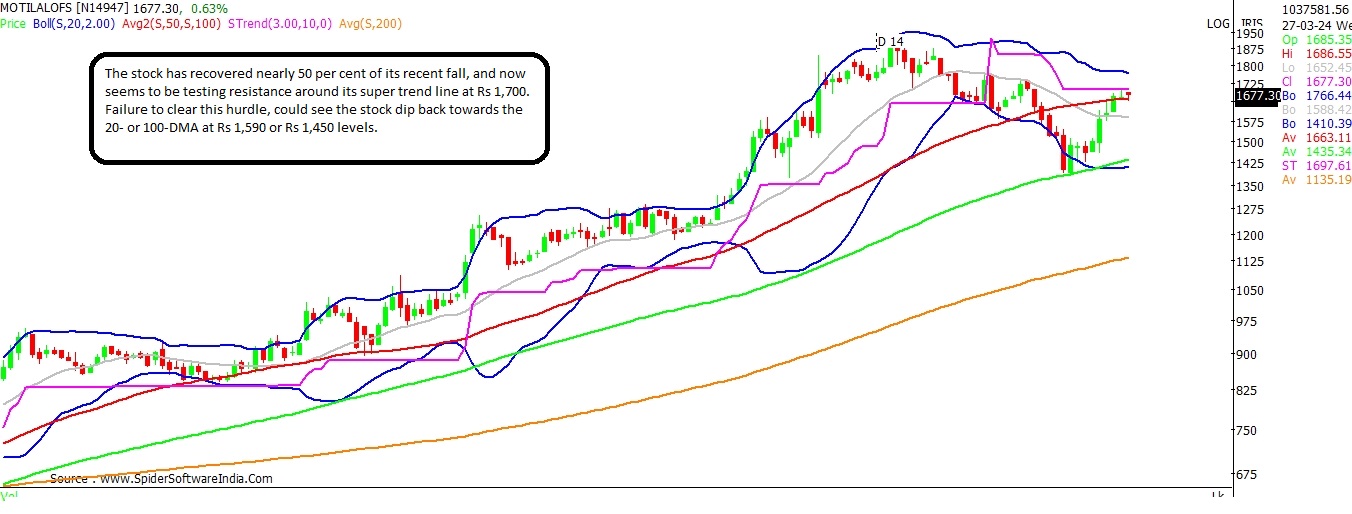
3 min read Last Updated : Mar 27 2024 | 12:53 PM IST
Shares of brokerage firms have witnessed a sharp sell-off in the last two months, having declined up to 40 per cent, even as the benchmark indices gained 2 per cent.
Will the beaten down stocks witness some pullback or is more pain in store?
The share price of IIFL Securities has witnessed a steep 40 per cent fall in the last two months, from its high of Rs 180 levels. Prior to that, the stock had surged 15 per cent in just eight months.
The recent low at Rs 108, suggests that the stock may have completed 61.8 per cent retracement of the previous rally. Further the Rs 108-level, is also close to the 200-DMA, which stands at Rs 104. Hence, the stock is expected to seek support around these levels. CLICK HERE FOR THE CHART
On the upside, the stock may look to bounce back towards the 20-DMA at Rs 127 levels or pullback and test the trend line resistance around Rs 135 which also coincides with the 38.2 per cent recovery mark of its recent fall.
Geojit Financial Services
Current Price: Rs 65
Upside Potential: 16.3%
Support: Rs 108; Rs 62.60
Geojit Financial Services has declined close to 32 per cent in the last two months. However, the stock seems to have found consistent support around its 200-DMA since the last three weeks. The 200-DMA presently stands at Rs 62.60. CLICK HERE FOR THE CHART
Select key momentum oscillators like the Stochastic Slow and MACD have turned favourable for the stock on the daily scale. Hence, the stock may attempt to recover part of its lost ground in the near-term as long as the 200-DMA is held.
On its way up, the stock may face some resistance around its 20-DMA at Rs 68.65, above which the stock may look to recover 38.2 per cent of the lost ground at Rs 72.20 or 50 per cent, which suggests an upside target of Rs 75.60.
Emkay Global
Current Price: Rs 113
Upside Potential: 17.7%
Support: Rs 105
Emkay Global has plunged 42 per cent in the last two months. However, the stock now seems to be seeking support around its 200-DMA, which it briefly broke last week, around Rs 105. CLICK HERE FOR THE CHART
Among the key momentum oscillators, the daily Stochastic Slow and MACD have turned positive. A 38.2 per cent and 50 per cent retracement from recent lows indicate an upside target of Rs 125 and Rs 133 for the stock.
Motilal Oswal Financial Services
Current Price: Rs 1,670
Downside Risk: 13.2%
Resistance: Rs 1,700; Rs 1,770
Motilal Oswal had plunged nearly 29 per cent from its high of Rs 1,938 in early February 2024 to a low of Rs 1,381 on March 14. The stock, thereafter, has recovered close to 50 per cent of its recent fall and quotes around Rs 1,670 levels.
Further, on the daily scale, the stock can be seen trading close to its super trend line resistance at Rs 1,700. The stock will need to cross and trade consistently above this trend line resistance for further up move. Following which, the stock can potentially rally to Rs 1,770 levels.
On the other hand, failure to clear the hurdle can lead to test of its 20-DMA at Rs 1,590 or further lower towards the 100-DMA at Rs 1,450. CLICK HERE FOR THE CHART