ITC stock gained 2.8 per cent at the day's high of ₹433.20 in intra-day trades on Friday, a day after the
FMCG giant reported its Q4 results.
ITC reported an adjusted net profit of ₹5,155.27 crore for the quarter ended March 2025, up 3 per cent when compared with ₹4,934.80 crore reported in the same quarter a year ago. Revenue from operations grew marginally from ₹20,349.96 crore to ₹20,376.36 crore in the same comparable period.
In fact, ITC reported a consolidated net profit of ₹19,727.37 crore for Q4FY25, which included an exceptional gain from discontinued operations, specifically related to the demerger of the company's hotels business. The company also declared a dividend of ₹7.85 per share.
READ MORE Meanwhile, on the bourses, ITC stock has been consolidating around its 200-Day Moving Average (200-DMA), which stands at ₹431.80 for more than a month.
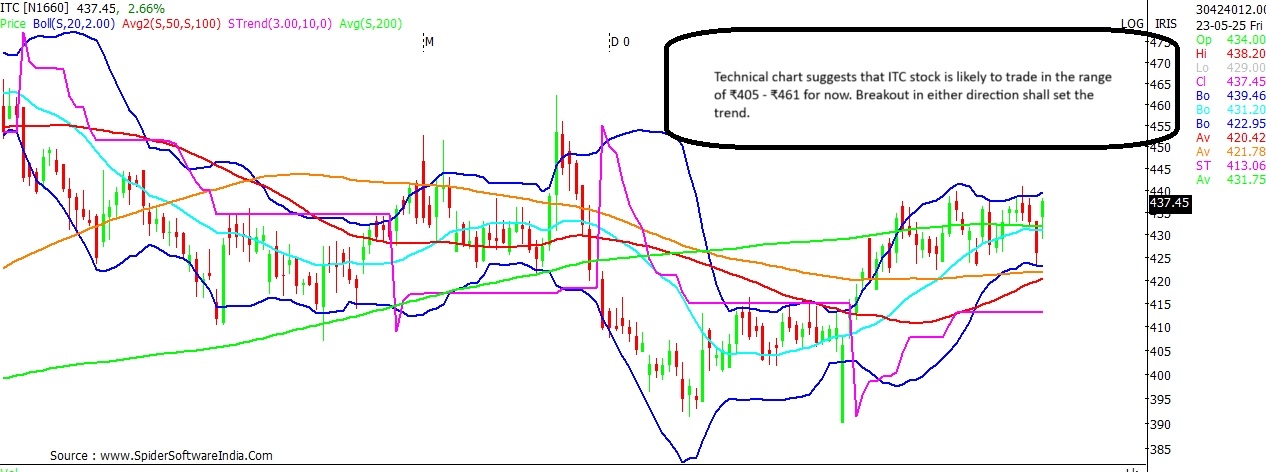
Can the recent Q4 results help the stock take a directional move? How much can the stock rise or fall from current levels? Here are the key levels to watch out for on the ITC stock as per the technical charts.
ALSO READ | Sensex rejig: Buy BEL, Trent; Sell Nestle, IndusInd Bank? Charts say this ITC
Current Price: ₹437
Anticipated range: ₹405 - ₹461
Support: ₹432; ₹422; ₹413; ₹405
Resistance: ₹450; ₹461
Even as
ITC stock consolidates around the 200-DMA, the weekly chart clearly indicates limited upside for the stock for now. As per the weekly chart, upside for the ITC stock seems capped around ₹461 for now. Interim resistance for the stock is placed at ₹450 levels.
The long-term chart suggests that ITC stock will need to break and trade consistently above the ₹461 hurdle for the broader trend to turn favourable.
ALSO READ | Nifty stock alert! BEL, Tata Steel trade in overbought zone; warning sign? On the other hand, the stock seems well protected with the presence of multiple support levels on the downside. Below the 200-DMA, significant support for ITC stock can be anticipated around its 100-DMA at ₹422 levels. The short-term bias for the stock is expected to remain cautiously positive as long as the stock holds above ₹413 and ₹405 levels.
A monthly close below ₹405 should be considered as a warning sign for the stock.
CLICK HERE FOR THE CHART  "How much upside can ITC stock see post Q4 results? Find out here")


