KEI can crack up to 25%; check PolyCab, Havells target price as per charts
Meanwhile, technical charts of the new entrant UltraTech Cement in the wires & cables business indicates a likely downside risk of up to 17% for the stock.
Rex Cano Mumbai Following the sharp near 20 per cent fall in stock prices on Friday, shares of wires & cables makers were trading on tepid note thus far in intra-day deals on Monday amid concerns over the likely impact of UltraTech Cement's entry into the segment.
As of 10 AM, KEI Industries, Polycab India and Havells India were trading with losses of up to 2 per cent; whereas UltraTech Cement stock held a 2 per cent gain. Meanwhile, the benchmark equity indices - the
BSE Sensex and the NSE Nifty were down around 0.3 per cent each.
Here's a technical outlook on the key players in the wires & cables business along with UltraTech Cement.
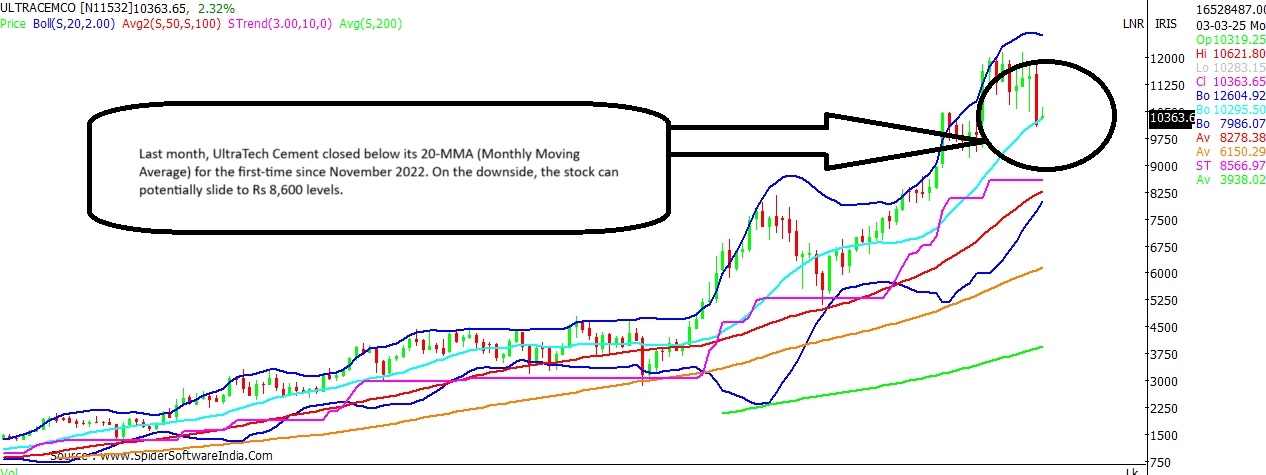
UltraTech Cement Current Price: Rs 10,308
Downside Risk: 16.7%
Support: Rs 9,800; Rs 9,500; Rs 9,200
Resistance: Rs 11,100
Last month,
UltraTech Cement closed below its 20-MMA (Monthly Moving Average) for the first-time since November 2022. This is considered as a negative development on the long-term scale, and suggests that the stock may witness a tepid trend going ahead.
CLICK HERE FOR THE CHART Technical chart shows that the stock now seems headed towards its 100-WMA (Weekly Moving Average) at Rs 9,800 levels. Break and sustained trade below the same can trigger a fall towards Rs 8,600 levels. Interim support for the stock exists at Rs 9,500 and Rs 9,200 levels. Upside for the stock seems capped around Rs 11,100 levels.
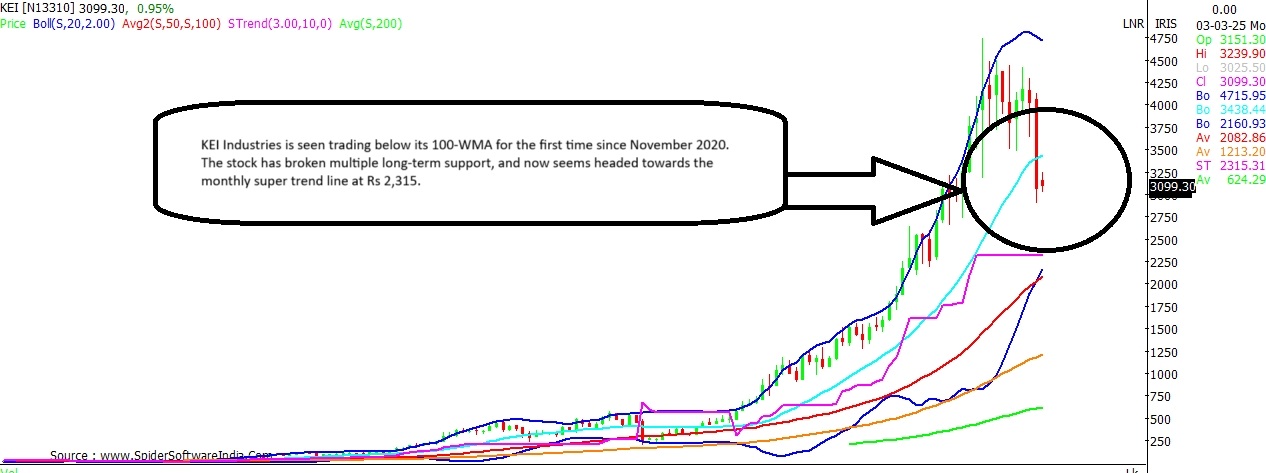
ALSO READ: Tata Motors sinks 47% in 7 months, fall similar to 2015; stock headed to? KEI Industries Current Price: Rs 3,100
Downside Risk: 25.3%
Support: Rs 2,670
Resistance: Rs 3,435
KEI Industries is seen trading below its 100-WMA for the first time since November 2020. The stock has broken multiple long-term support, and now seems headed towards the monthly super trend line at Rs 2,315; with interim support for the stock seen at Rs 2,670. The overall bias for the stock is expected to remain tepid as long as the stock remains below Rs 3,900. Near resistance for the stock exists at Rs 3,435.
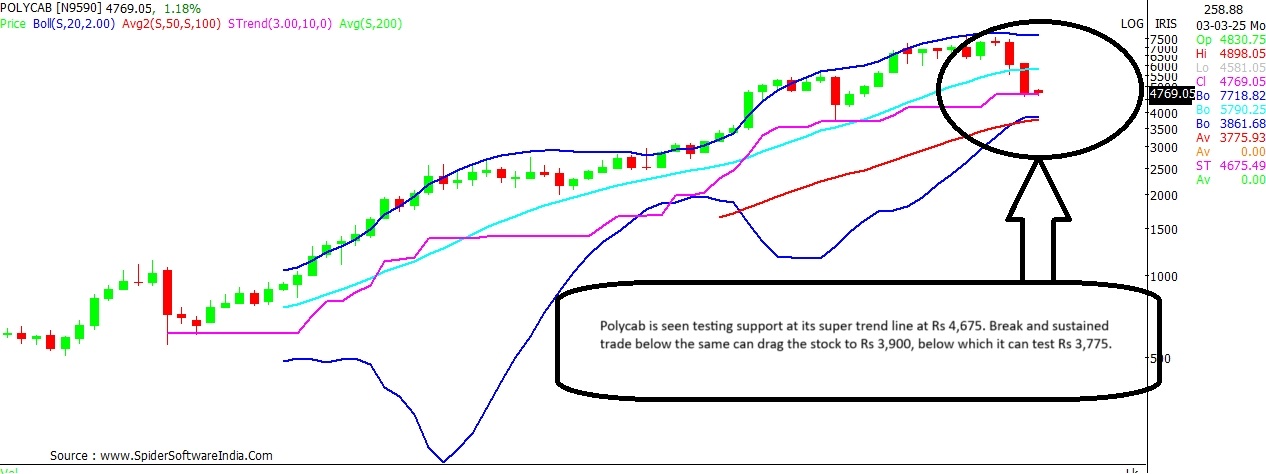
CLICK HERE FOR THE CHART Polycab India Current Price: Rs 4,715
Downside Risk: 20%
Support: Rs 4,675; Rs 3,900
Resistance: Rs 5,800
Polycab stock is seen testing support at its super trend line on the monthly scale at Rs 4,675. Break and sustained trade below the same can drag the stock towards 3,775 levels, with interim support likely around the 200-WMA at Rs 3,900 levels. At present, the stock is seen trading below its 20-MMA, which stands at Rs 5,800 levels. Thus the overall bias will remain tepid as long as the stock trades below the same.
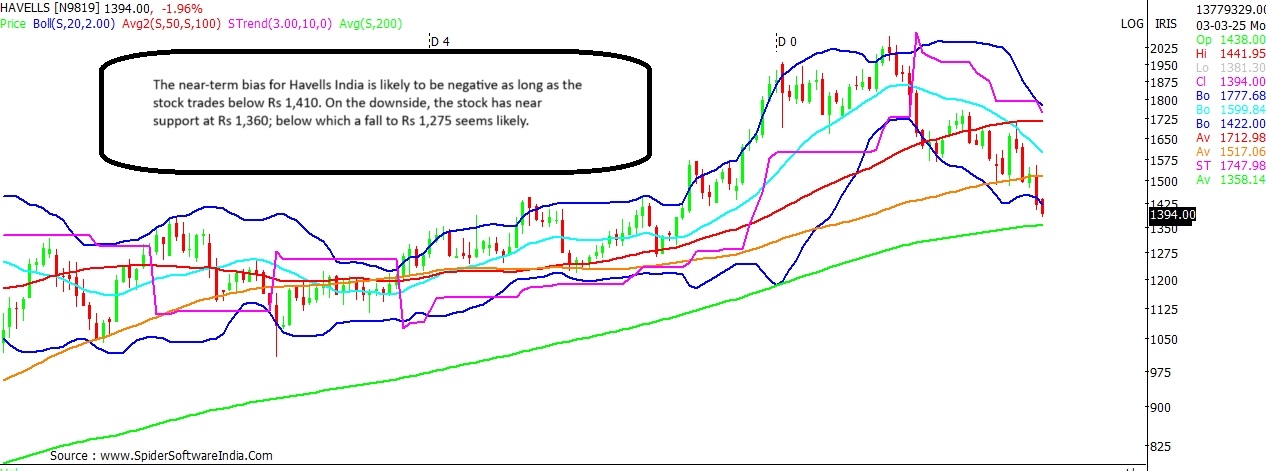
CLICK HERE FOR THE CHART ALSO READ: Can Nifty fall 20% from peak to enter bear phase? Chart check Havells India Current Price: Rs 1,400
Downside Risk: 9%
Support: Rs 1,360
Resistance: Rs 1,560
The near-term bias for
Havells India is likely to remain negative as long as the stock trades below Rs 1,410. On the downside, the stock has near support at Rs 1,360 in the form of its 200-WMA - a key moving average the stock has not violated since June 2020. The long-term chart shows the stock could slip to 1,275, with interim support at Rs 1,300. The bias for the stock is expected to remain subdued as long as the stock trades below Rs 1,560.
CLICK HERE FOR THE CHART  "KEI can crack up to 25%; check PolyCab, Havells target price as per charts")
