The Nifty Metal index plunged nearly 4 per cent to a low of 7,979 in Monday's trading session amid a US tariff-triggered global sell-off. At 10.30 AM, the Metal index quoted at 8,109 - down 2.3 per cent; while the NSE benchmark
Nifty 50 index was down 0.9 per cent at 23,280.
Asian markets fell up to 4 per cent, with Taiwan taking the biggest hit followed by Kospi and Japan's Nikkei today after the US President imposed a 25 per cent tariff on Canada-Mexico, and a 10 per cent duty on goods imported from China.
The US President Donald Trump has also threatened up to
100 per cent tariffs on BRICS nations, which includes India, if these countries continued de-dollarisation efforts, meaning seeking ways to replace the USD as a reserve currency.
Meanwhile,
on the bourses among the metal stocks, National Aluminium (NALCO), Vedanta, SAIL and NMDC were the major losers, down around 5 per cent each. Hindustan Copper, Hindalco, APL Apollo and Tata Steel were the other significant losers, down over 3 per cent each.
ALSO READ: Nifty may target 24,300 post Budget; Trump tariff, RBI policy key triggers As such, here's a technical outlook on 5 metal shares that can decline up to 16 per cent in case they break the key support levels on the charts.
Nifty Metal Current Level: 8,100
Downside Risk: 15.4%
Support: 7,070
Resistance: 8,360; 8,700
Technically, the
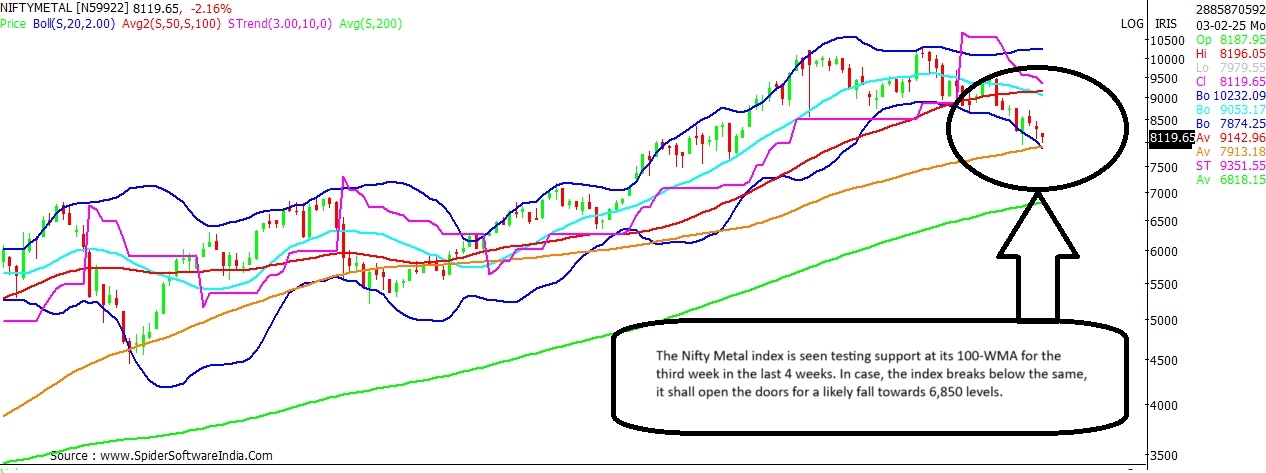
Nifty Metal index is seen testing its 100-WMA (Weekly Moving Average), placed at 7,912 for the third time in the last four weeks. That apart, the Metal index has near support at 8,040 on the daily chart. As long as this support zone is protected, the Nifty Metal index can attempt to consolidate and recover some of its lost ground. In the last four months, the Metal index has declined by nearly 18 per cent.
CLICK HERE FOR THE CHART The key hurdle for the Metal index on the way up stands at 8,360; above which the index can possibly spurt to 8,700 levels. On the other hand, a downward breakout, shall open the doors for a likely fall towards the 200-WMA at 6,850 levels; with interim support placed at 7,070 levels.
Tata Steel Current Price: Rs 130
Downside Risk: 16.2%
Support: Rs 121; Rs 118
Resistance: Rs 137; Rs 148
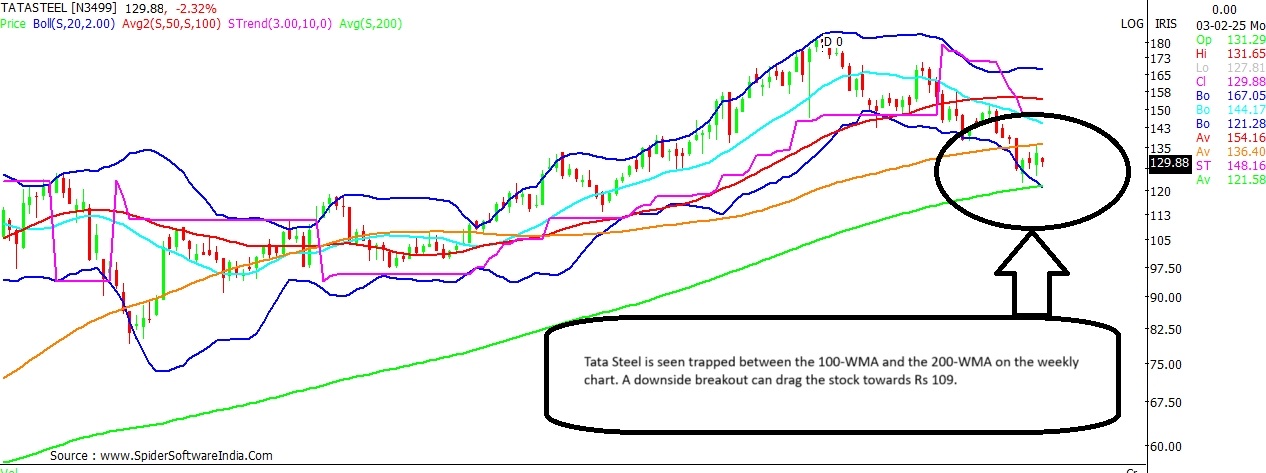
Tata Steel seems to be trapped between the 100-WMA and the 200-WMA on the weekly chart; indicating support at Rs 121 and resistance at Rs 137. The key momentum oscillators on the weekly chart seem to be in favour of the bears. As such, in case of a downward breakout Tata Steel can extend the fall towards Rs 109; with interim support at Rs 118. The overall bias for the stock is likely to remain tepid as long as the stock trades below Rs 148.
CLICK HERE FOR THE CHART ALSO READ: Bajaj Finance, TaMo, Maruti: Largecap buy, sell stock ideas post Q3 results Hindalco Current Price: Rs 571
Downside Risk: 13.7%
Support: Rs 558
Resistance: Rs 595; Rs 640
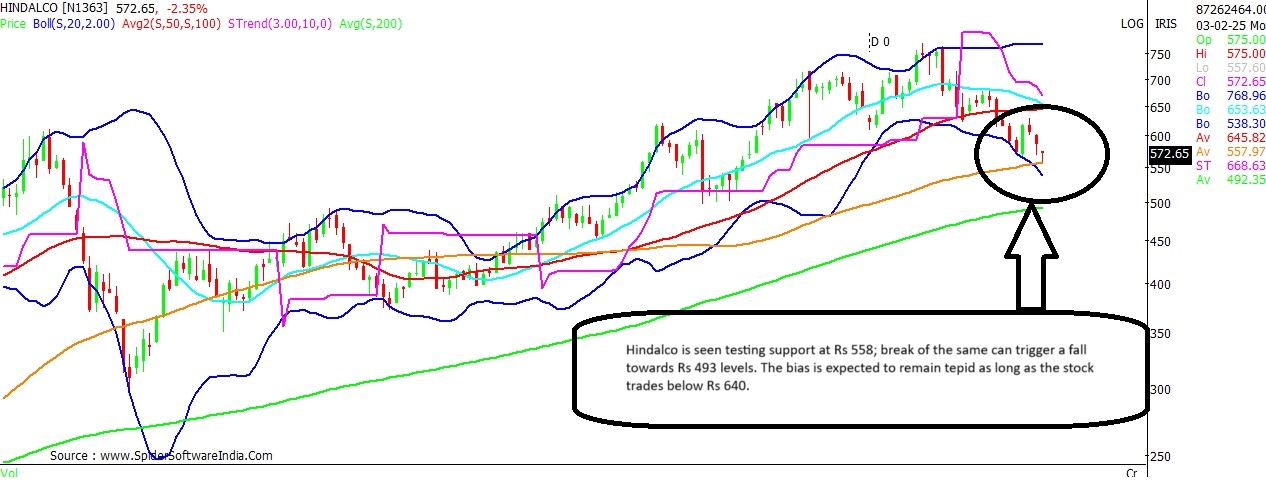
The near-term bias for
Hindalco is expected to remain tepid as long as the stock trades below Rs 595. The broader trend indicates a likely negative bias as long as the stock remains below Rs 640. On the downside, the stock is seen testing the key 100-WMA support at Rs 558; break of the same can trigger a fall towards Rs 493 levels.
CLICK HERE FOR THE CHART National Aluminium (NALCO) Current Price: Rs 189
Downside Risk: 11.6%
Support: Rs 183
Resistance: Rs 197; Rs 210
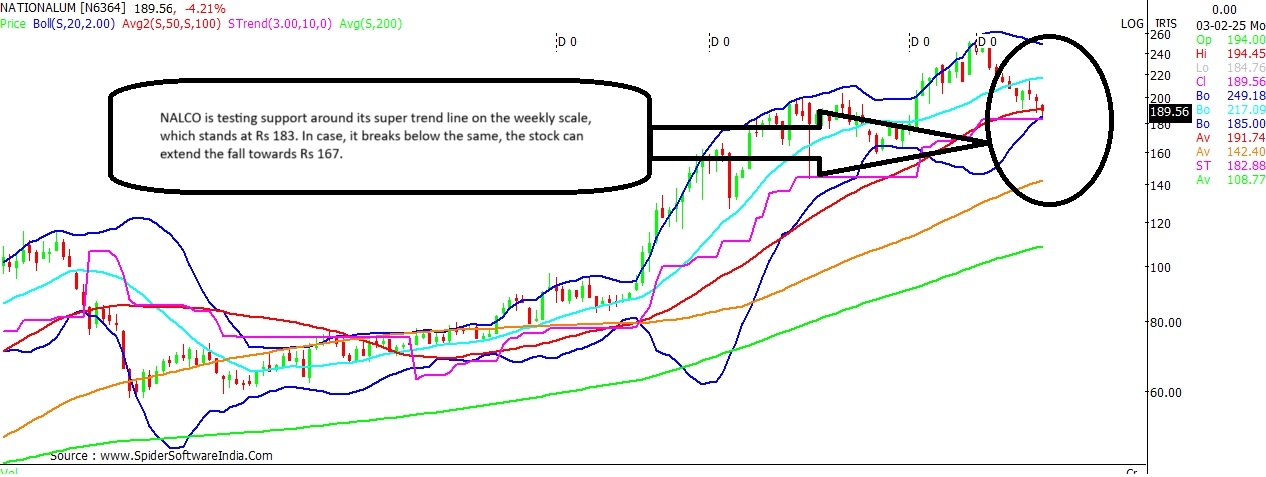
NALCO stock is seen seeking support around its weekly super trend line, which stands at Rs 183, a key indicator the stock has now violated since April 2023. On the daily scale, the stock is seen trading consistently below the 200-DMA at Rs 197. The overall bias at the counter is expected to remain subdued as long as the stock trades below Rs 210. On the downside, the stock can potentially slide towards Rs 167 levels.
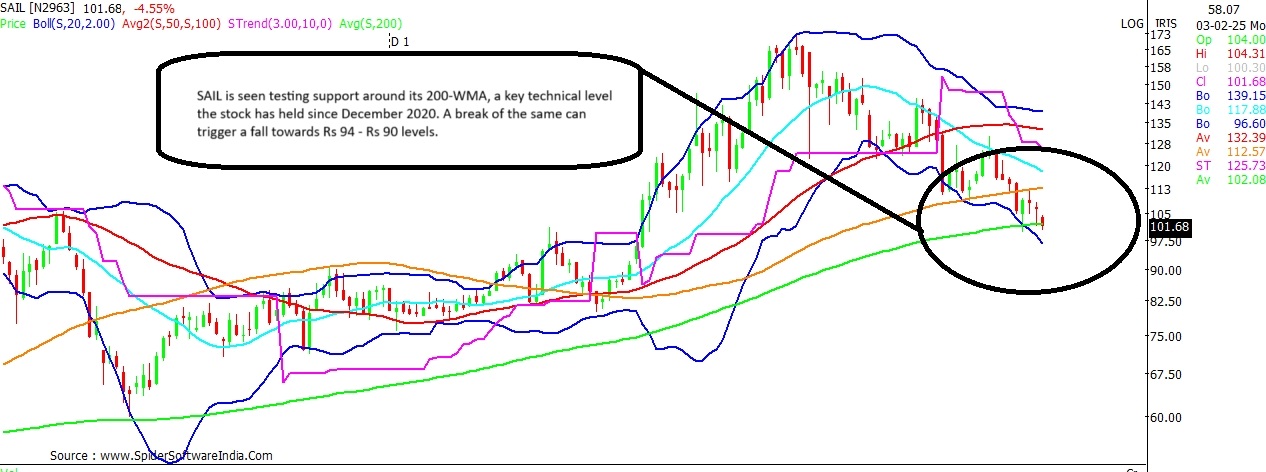
CLICK HERE FOR THE CHART SAIL Current Price: Rs 102
Downside Risk: 11.8%
Support: Rs 102; Rs 94
Resistance: Rs 106; Rs 110
SAIL is seen testing its 200-WMA support, which stands at Rs 102, a key technical indicator the stock has now violated since December 2020. As long as this support is held, an interim relief rally at the counter can lift the stock to Rs 106 - Rs 110 levels; wherein stand the key hurdles. On the downside, a breakout below the 200-WMA, can drag the stock towards Rs 94 and Rs 90 levels.
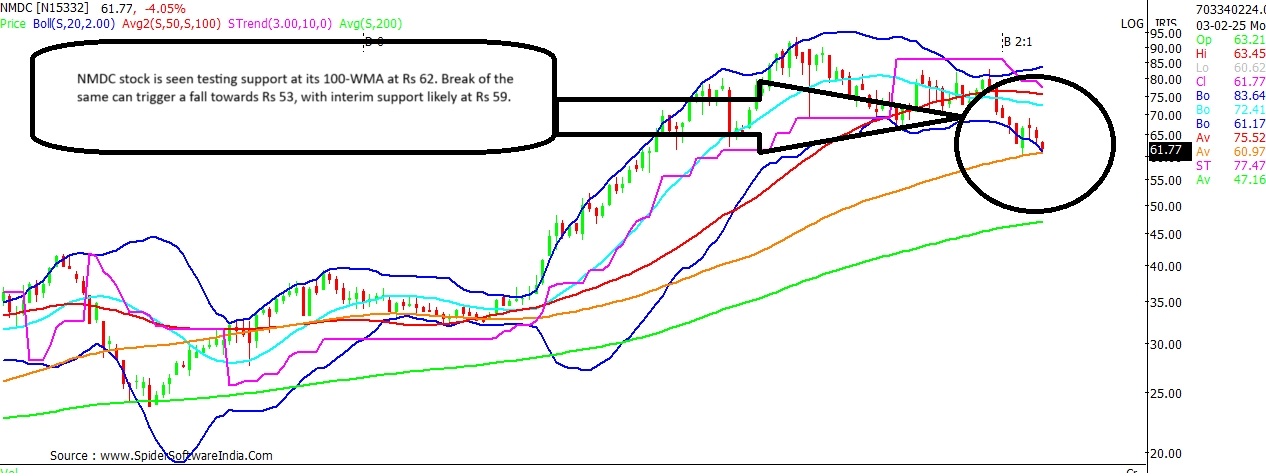
CLICK HERE FOR THE CHART NMDC Current Price: Rs 62
Downside Risk: 14.5%
Support: Rs 62; Rs 59
Resistance: Rs 66; Rs 72
NMDC stock is seen testing support at its 100-WMA at Rs 62. The bias at the counter is likely to remain tepid as long as the stock trades below Rs 72, with near resistance seen at Rs 66. On the downside, the stock seems on course to test the super trend line support on the monthly scale at Rs 53; interim support for the stock is seen at Rs 59.
CLICK HERE FOR THE CHART  "Nifty Metal eyes 15% fall if it breaks 7,900; these stocks may be worst hit")