Will ITC break Rs 400-mark as BAT mulls stake sale? Here's what chart say

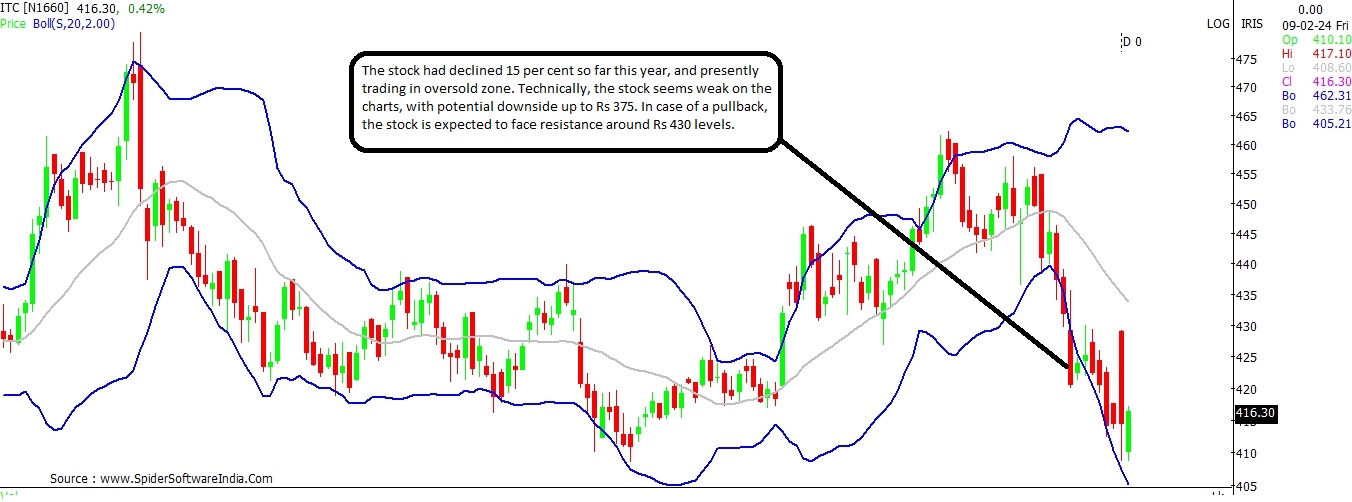
Technically, the stock seems placed unfavourably on multiple parameters. However, a pullback cannot be ruled out, as it trades in oversold zone too.

A man talks on his mobile phone as he walks past an ITC office building in Kolkata. Photo: Reuters
Rex Cano Mumbai
3 min read Last Updated : Feb 09 2024 | 10:57 AM IST
Shares of ITC have been on a steady decline since the start of the calendar year 2024. The selling pressure at the counter accentuated after the FMCG major reported its December quarter earnings on January 29, 2023. As of date, the stock has declined 15 per cent so far this year as against 1 per cent fall on the S&P BSE Sensex.

On Thursday, the stock hit an 8-month low on sliding 4 per cent after the company's largest shareholder, British American Tobacco (BAT), said it was planning to pare stake in the company.

BAT holds 29.03 per stake in ITC through Tobacco Manufacturers (India) Limited, Myddleton Investment Company Limited and Rothmans International Enterprises Limited.

Earlier on January 29, the company reported 8.9 per cent year-on-year (YoY) growth in Q3 consolidated net profit at Rs 5,406.52 crore for the quarter ended December 2023 when compared with Rs 4,964.52 crore in the corresponding quarter a year ago. Revenue from operations increased by 1.1 per cent YoY to Rs 19,484.50 crore.

The company's operating performance lagged street expectation due to lower-than-expected revenue growth affected by a decline in the agri-business revenues, lower than expected growth in the hotel business and a soft cigarette performance. READ MORE

The stock also turned ex-dividend on Thursday. The company had declared an interim dividend of Rs 6.25 per share.

Against this background, here's how ITC looks placed on the charts.

ITC
Current Price: Rs 416
Support: Rs 397; Rs 375
Resistance: Rs 430
Downside Risk: 10% 

The stock is trading in fairly oversold zone on the daily scale, with RSI (Relative Strength Index) reading of 23.3 levels. A RSI level below 30-mark is technically considered oversold. 

Presently, the stock is also seen treading along its lower-end of the Bollinger Bands which stands at Rs 414. The stock needs to consolidate above the same, in order to attempt a pullback. In case of a pullback the stock may face resistance around Rs 430 levels. CLICK HERE FOR THE CHART

Further, the bias as per price-to-moving averages action is also clearly negative, as the stock trades fairly below its key moving averages. 

Having said that, key momentum oscillators are indicating a mixed pattern. While Slow Stochastic and MACD (Moving Average Convergence-Divergence) are showing some signs of exhaustion and possible trend reversal. The DI (Directional Index) is firmly in favour of further downside, with rising strength.

On the weekly scale, the stock is trading below its key support at Rs 420. A weekly close below Rs 420 could indicate further weakness at the counter. On the downside, the stock seems on course to tests its 100-WMA (Weekly Moving Average) which stands at Rs 375 - thus indicating a downside potential of 10 per cent from present levels.

Meanwhile, on the monthly scale the stock has near support at Rs 397.


One subscription. Two world-class reads.

Already subscribed? Log in

Subscribe to read the full story →
*Subscribe to Business Standard digital and get complimentary access to The New York Times

Smart Quarterly

₹900

3 Months

₹300/Month

SAVE 25%

Smart Essential

₹2,700

1 Year

₹225/Month

SAVE 46%
*Complimentary New York Times access for the 2nd year will be given after 12 months

Super Saver

₹3,900

2 Years

₹162/Month

Subscribe

Renews automatically, cancel anytime

Here’s what’s included in our digital subscription plans

Exclusive premium stories online

  • Over 30 premium stories daily, handpicked by our editors

Complimentary Access to The New York Times

  • News, Games, Cooking, Audio, Wirecutter & The Athletic

Business Standard Epaper

  • Digital replica of our daily newspaper — with options to read, save, and share

Curated Newsletters

  • Insights on markets, finance, politics, tech, and more delivered to your inbox

Market Analysis & Investment Insights

  • In-depth market analysis & insights with access to The Smart Investor

Archives

  • Repository of articles and publications dating back to 1997

Ad-free Reading

  • Uninterrupted reading experience with no advertisements

Seamless Access Across All Devices

  • Access Business Standard across devices — mobile, tablet, or PC, via web or app

Topics :Market technicalsFMCG ITCTrading strategiesFMCG stocksstocks technical analysistechnical chartsMarket Outlook

Next Story