IPL helps Sony Max trump Star Plus in ratings race
Viewership in ratings points has gone up by 30% compared to last year
Urvi Malvania Mumbai As the Indian Premier League (IPL) continues on its journey in this edition, the tournament’s viewership continues to grow as compared to last year.
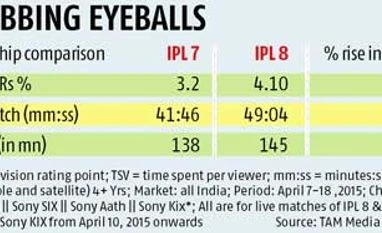
For the 14 cricket matches held between April 8 and April 18, the tournament registered a 30 per cent increase in average television ratings (TVR) from 3.2 in IPL 7 to 4.1 in IPL 8. This data includes viewership from Sony Max, Sony Six, Sony Aath and Sony Kix (from April 10) and represents viewership in the TAM CS 4+, all India market (viewers more than four years old from cable and satellite households across India).
While the viewership in ratings points has gone up by 30 per cent, the reach of the IPL this season has also increased over last year. From 138 million unique viewers last year, the tournament has reached 145 million unique viewers this year. In terms of percentage of the total TV viewing universe, IPL 7 reached 52 per cent, while IPL 8 has so far reached 54 per cent.
Perhaps the most encouraging factor in the viewership data for the IPL this year is the fact that the average time spent per viewer per match has gone up by 17 per cent, indicating greater stickiness to the content. Each match was viewed on an average for 49.04 minutes this year, as against 41.46 minutes in 2014.
Last year, the IPL was shifted to the United Arab Emirates in the initial weeks due to general elections in the country. Media planners and experts believe this could have affected ratings. This year, with all the matches being played in India, viewership seems to be back on track. Additionally, this year, the controversy surrounding the match fixing and betting scam of 2013 has died down with greater clarity on the fate of the two implicated teams, Chennai Super Kings and Rajasthan Royals.
Also, the IPL in 2014 was telecast in Hindi and English while this year it is available on five channels in five languages. Sony Max continues to provide the Hindi commentary and Sony Six and Sony Six HD provide the English feed. Multi Screen Media’s Bengali general entertainment channel Sony Aath airs the Bengali feed and the newly launched Sony Kix airs the Tamil and Telugu feeds.
The highest rated match so far was the opening match between Mumbai Indians and Kolkata Knight Riders, played at the Eden Gardens stadium on April 8. This was followed by the KKR vs Royal Challengers Bangalore match on April 11, also at the Eden Gardens.
| GRPs of Hindi GECs - Wk 15 Vs Wk 16 2015 |
| Rank | Channel | Wk 15 | Wk 16 | Gain/Loss |
| 1 | Star Plus | 281 | 254 | -26 |
| 2 | COLORS VIACOM18 | 191 | 189 | -2 |
| 3 | Zee TV | 182 | 176 | -5 |
| 4 | Life OK | 134 | 135 | 0 |
| 5 | SONY SAB | 138 | 127 | -11 |
| 6 | SONY ENTERTAINMENT TV | 103 | 108 | 5 |
| 7 | &TV | 41 | 46 | 5 |
| 8 | Z Anmol | 43 | 44 | 1 |
| 9 | Star Utsav | 44 | 44 | 0 |
| 10 | Rishtey | 27 | 24 | -3 |
| 11 | SONY PAL | 21 | 22 | 1 |
| 12 | Sahara One | 3 | 3 | 0 |
| | | | | |
| | SONY MAX | 218 | 306 | 88 |
Source: TAM Media Research
Period: Wk 15 & 16, 2015
TG: CS 4+
Market: HSM (Hindi Speaking Market)
Channels: HGEC (Hindi General Entertainment Channels)
 "IPL helps Sony Max trump Star Plus in ratings race")