Shares of oil exploration and production companies gained ground on Wednesday owing to a rise in crude oil prices. Oil prices gained for the fourth day on Wednesday, extending a rally driven by hopes that a Covid-19 vaccine will boost fuel demand. On Tuesday, oil prices rose about 4 per cent to touch the
highest level since March.
So far in November, both WTI futures and Brent crude futures have rallied nearly 30 per cent, each.
So, is the rally in these stocks sustainable? Take a look at what charts indicate.
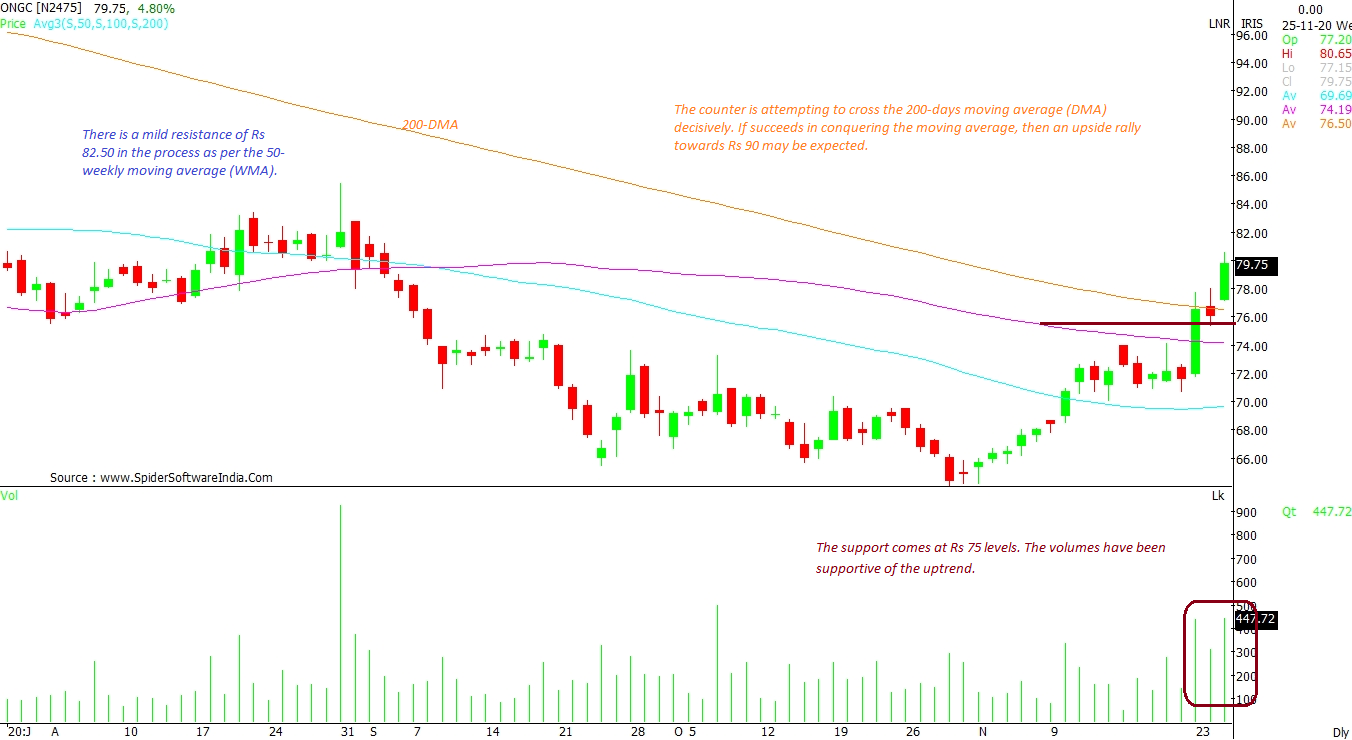
Oil & Natural Gas Corporation Ltd (ONGC): The counter is making attempts to cross the 200-day moving average (DMA) decisively. If it succeeds in conquering the moving average, then an upside rally towards Rs 90 may be expected. There is a mild resistance of Rs 82.50 in the process as per the 50-weekly moving average (WMA). The support comes in at Rs 75 levels. The volumes have been supportive of the uptrend.
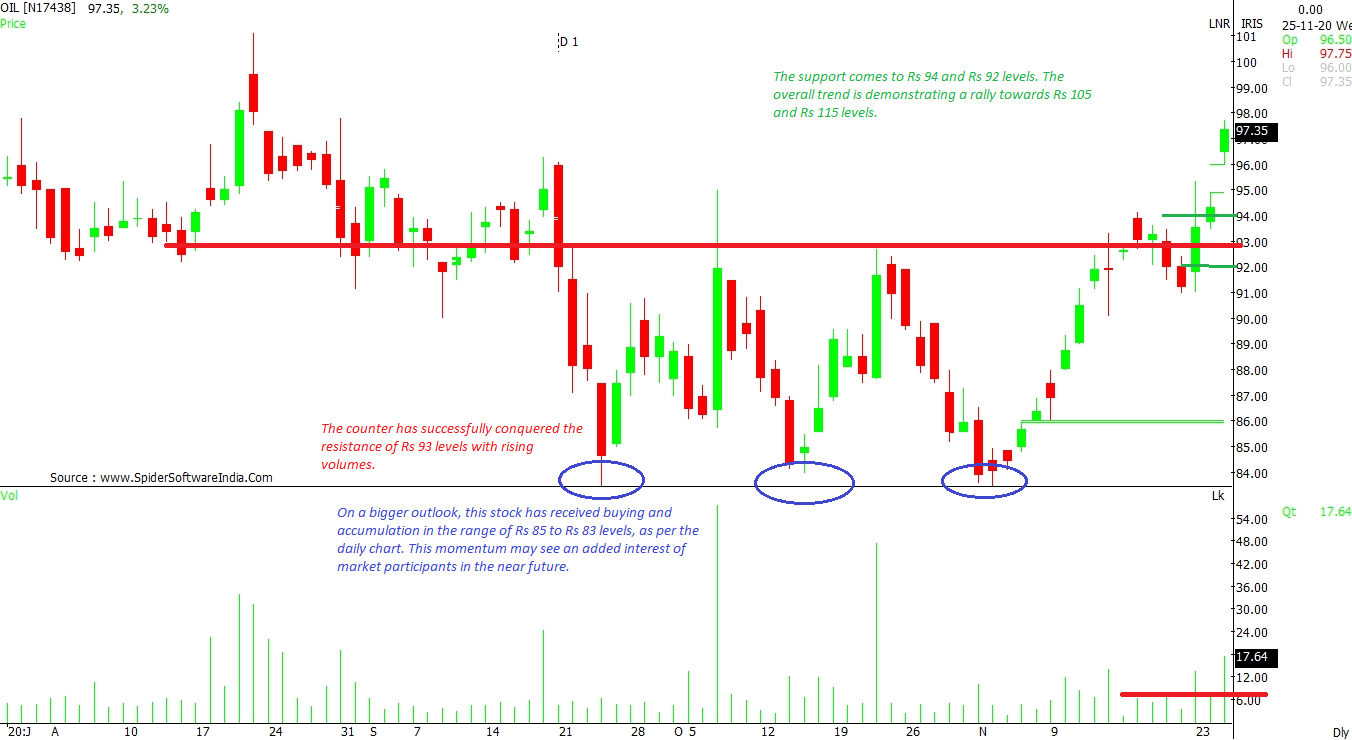
CLICK HERE FOR THE CHART Oil India Limited (OIL): The counter has successfully conquered the resistance of Rs 93 levels with rising volumes. On a bigger outlook, this stock has received buying and accumulation in the range of Rs 85 to Rs 83 levels, as per the daily chart. This momentum may see an added interest of market participants in the near future. The support comes in at Rs 94 and Rs 92 levels. The overall trend is demonstrating a rally towards Rs 105 and Rs 115 levels.
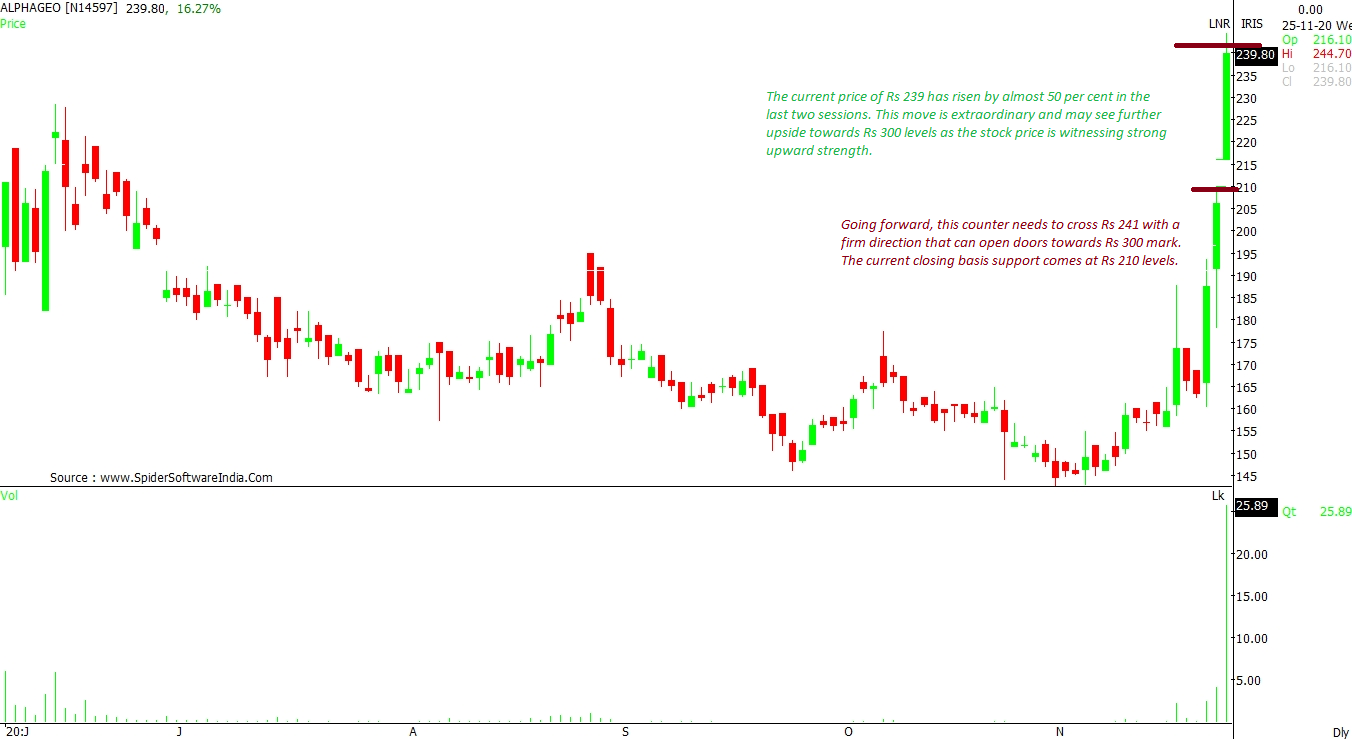
CLICK HERE FOR THE CHART Alphageo (India) Limited (ALPHAGEO): The stock price has risen by almost 50 per cent in the last two sessions. This move is extraordinary and may see further upside towards Rs 300 levels as the stock price is witnessing strong upward strength. Going forward, this counter needs to cross Rs 241 with a firm direction that can open doors towards Rs 300 mark. The current closing basis support comes in at Rs 210 levels.
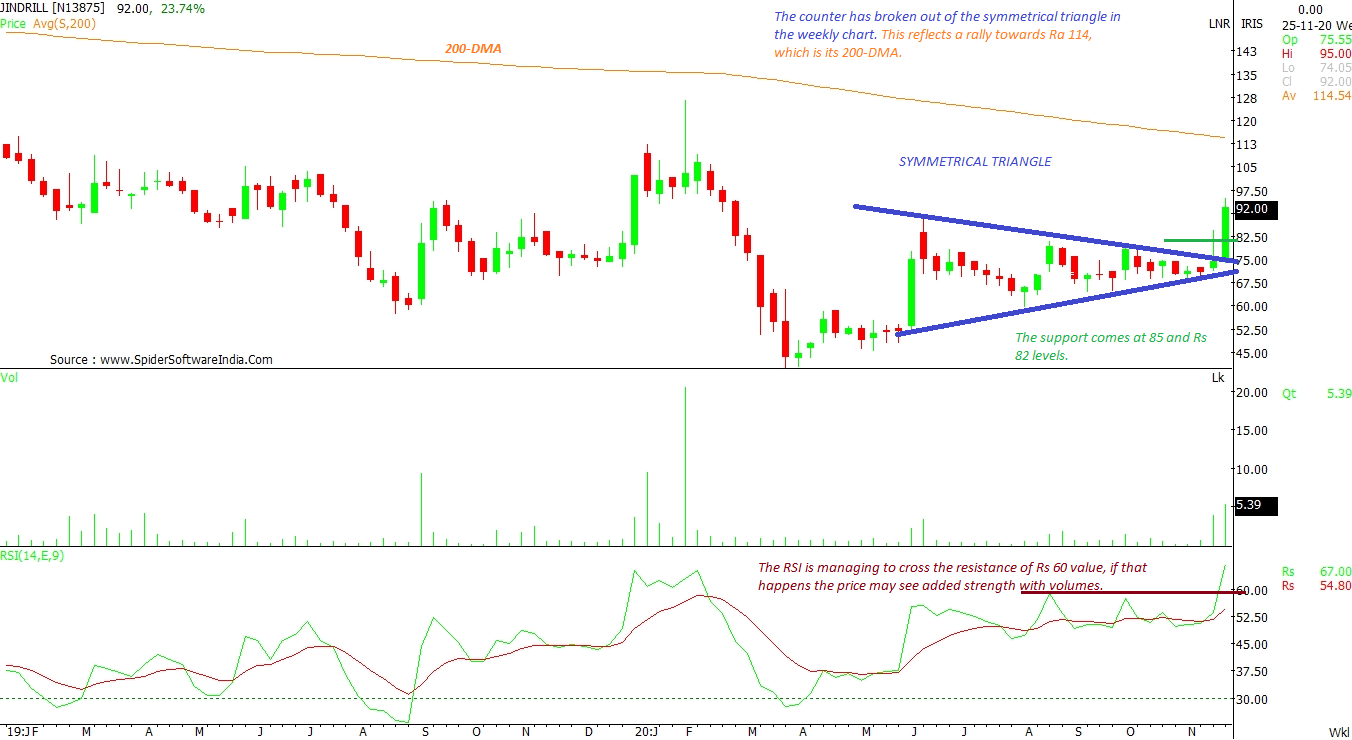
CLICK HERE FOR THE CHART Jindal Drilling And Industries Limited (JINDRILL): The counter has broken out of the symmetrical triangle around Rs 80 levels, as per the weekly chart. This reflects a rally towards Ra 114, which is its 200-DMA. The RSI is managing to cross the resistance of Rs 60 value, if that happens the price may see added strength with volumes. The support comes in at 85 and Rs 82 levels.
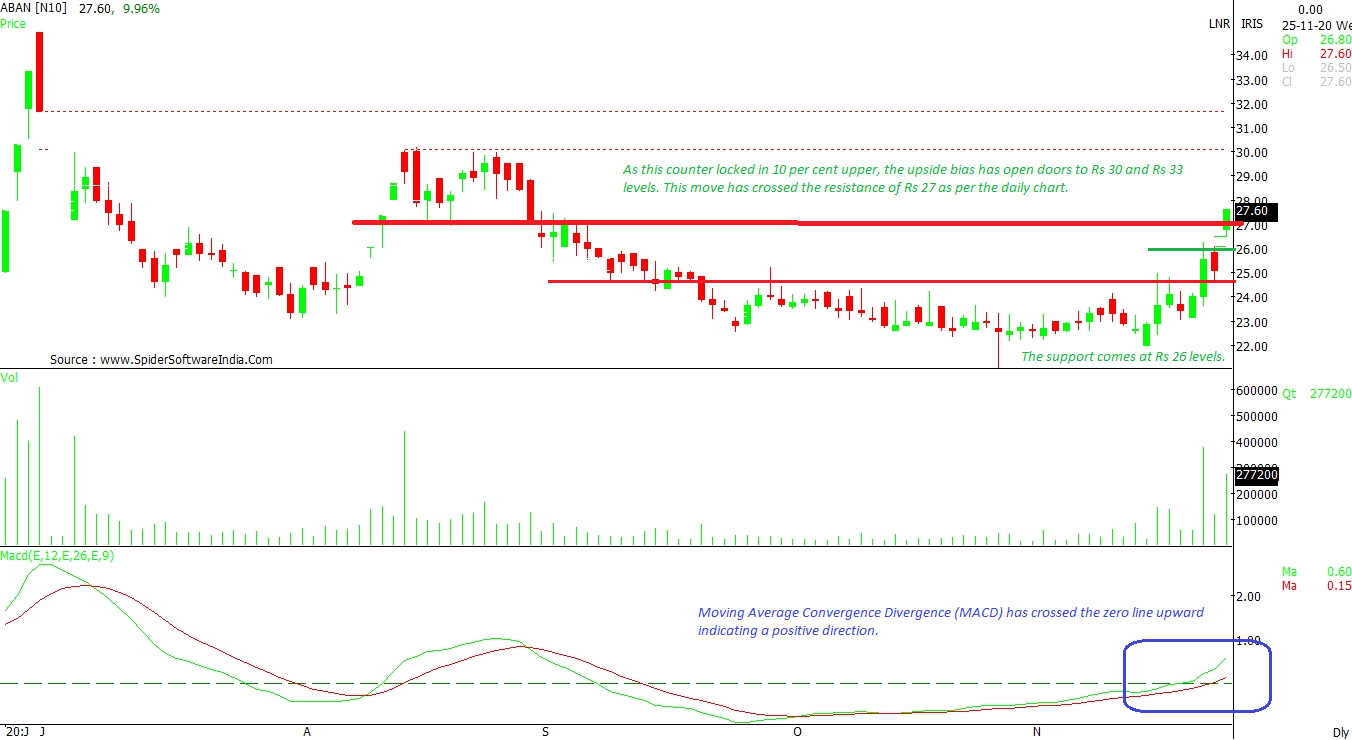
CLICK HERE FOR THE CHART Aban Offshore Limited (ABAN): As this counter is locked in the 10 per cent upper circuit, the upside bias has open doors to Rs 30 and Rs 33 levels. This move has crossed the resistance of Rs 27 as per the daily chart. Moving Average Convergence Divergence (MACD) has crossed the zero line upward indicating a positive direction. The support comes in at Rs 26 levels.
CLICK HERE FOR THE CHART  "ONGC, Aban Offshore: Oil exploration stocks may rally further, charts show")


