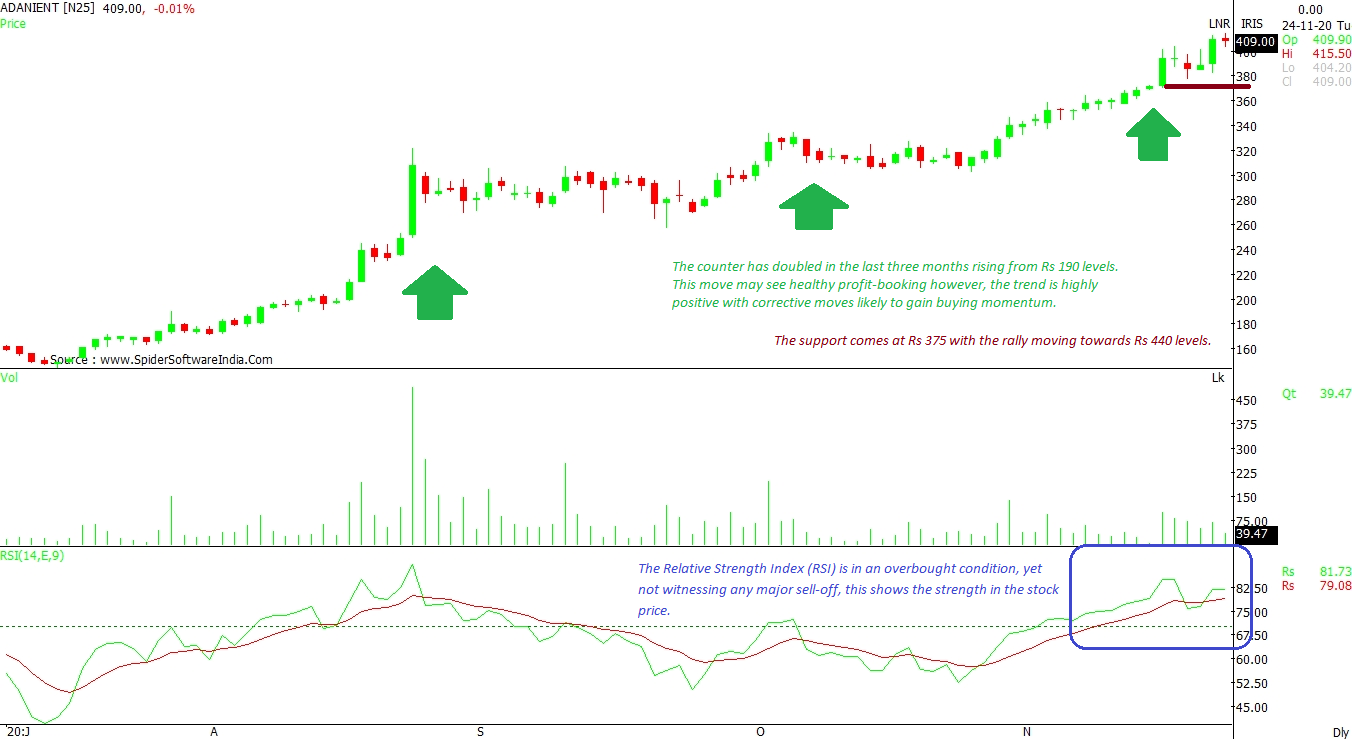
Adani Enterprises Ltd (ADANIENT): The counter has doubled in the last three months rising from Rs 190 levels. This move may see a healthy profit-booking; however, the trend is highly positive with corrective moves likely to gain buying momentum. The support comes in at Rs 375 with the rally moving towards Rs 440 levels. The Relative Strength Index (RSI) is in an overbought condition, yet not witnessing any major sell-off. This shows the strength in the stock price.
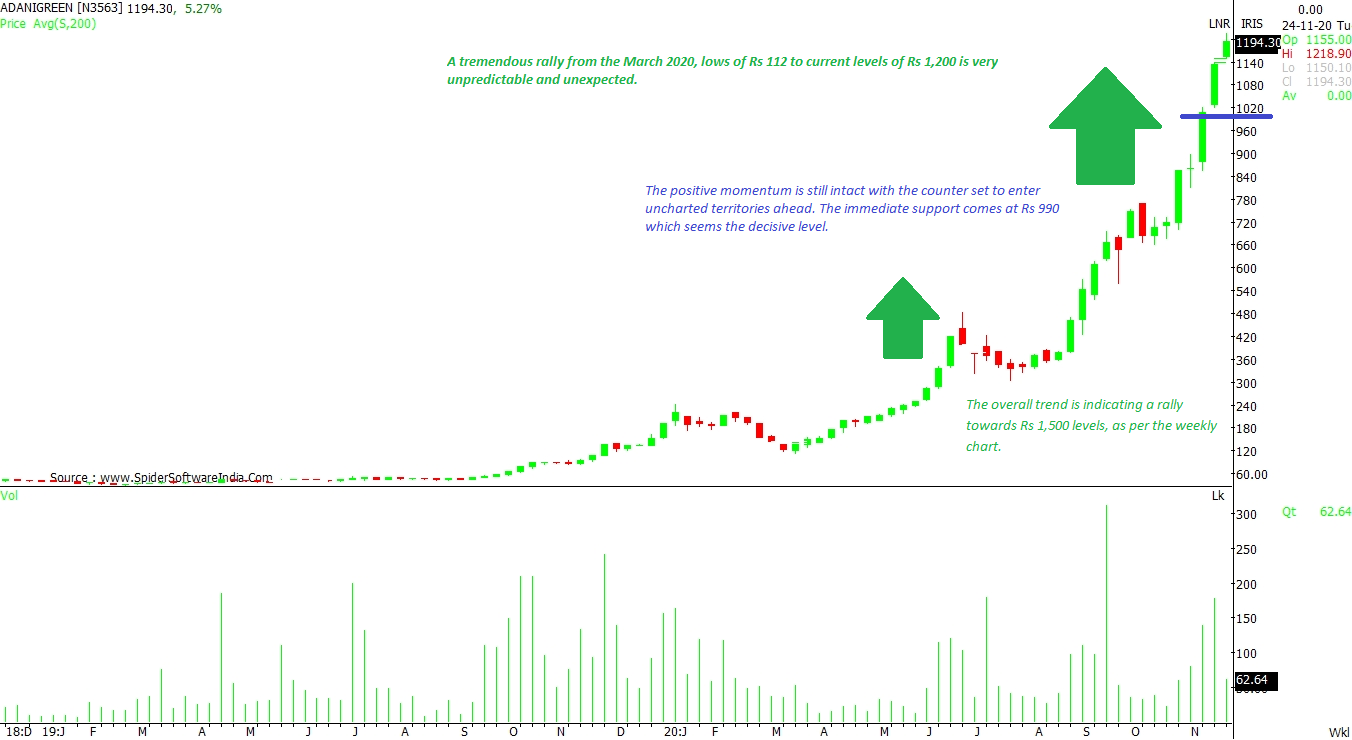
CLICK HERE FOR THE CHART Adani Green Energy Ltd (ADANIGREEN): This counter has witnessed a massive rally from the March 2020 lows of Rs 112 to the current levels of Rs 1,200. The positive momentum is still intact with the counter set to enter uncharted territories ahead. The immediate support comes in at Rs 990 which seems the decisive level. Till the stock trades above the same, the optimistic sentiment is here to stay. The overall trend is indicating a rally towards Rs 1,500 levels, as per the weekly chart.
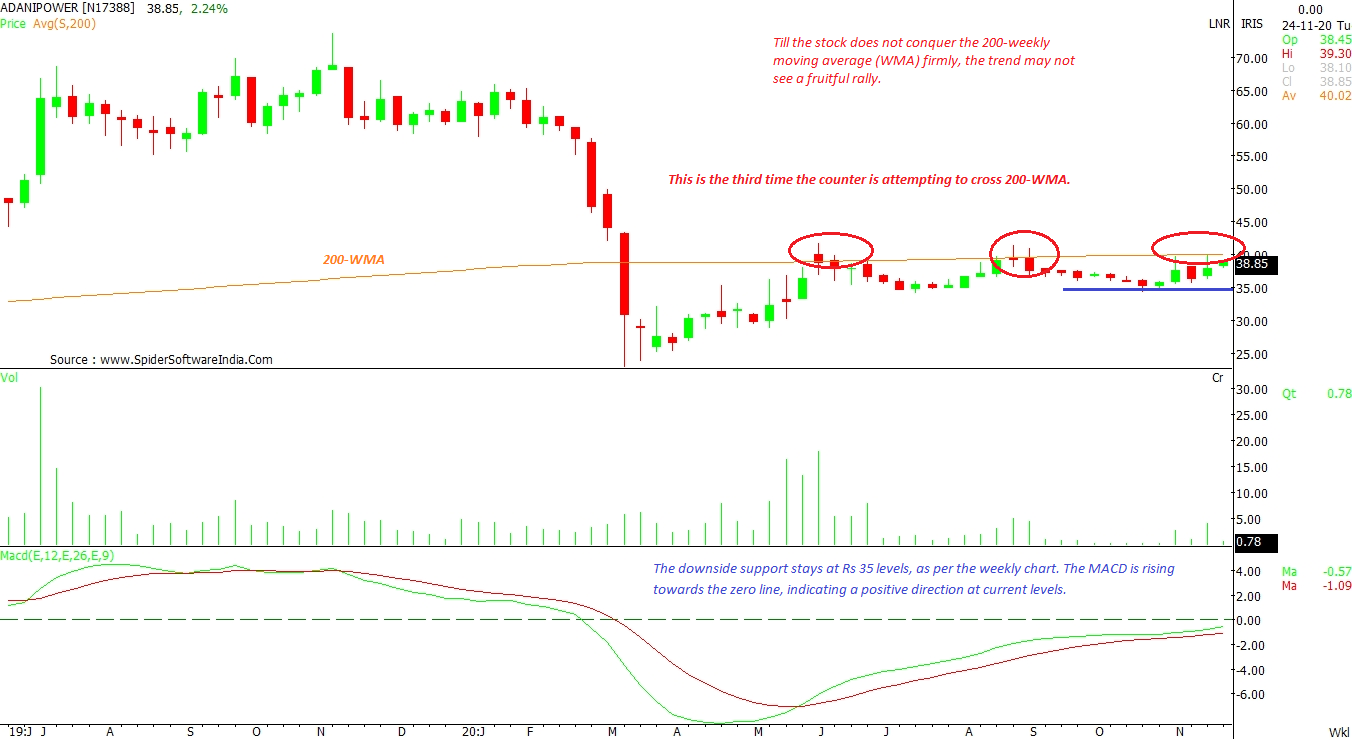
CLICK HERE FOR THE CHART Adani Power Ltd (ADANIPOWER): Till the stock does not conquer the 200-weekly moving average (WMA) firmly, the trend may not see a fruitful rally. This is the third time the counter is attempting to cross 200-WMA. The downside support stays at Rs 35 levels, as per the weekly chart. The MACD is rising towards the zero line, indicating a positive direction at current levels.
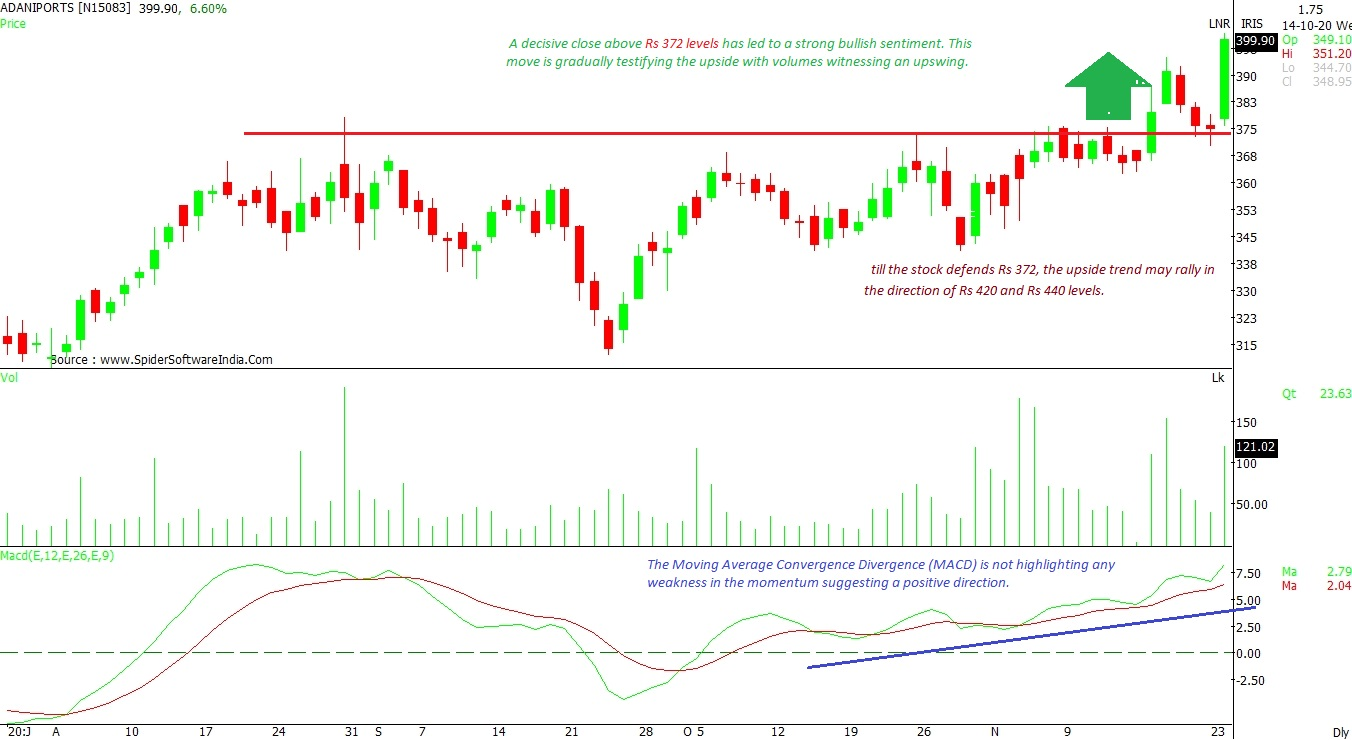
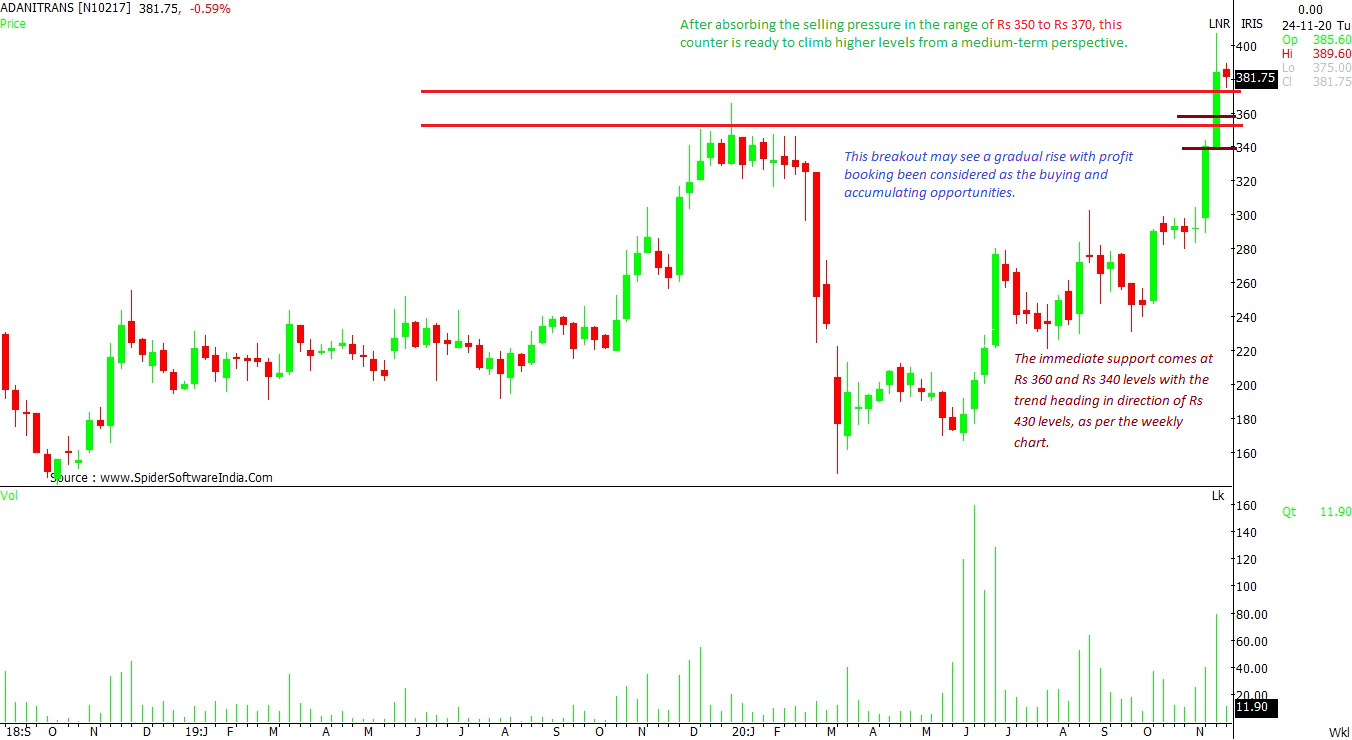
CLICK HERE FOR THE CHART Adani Transmission Ltd (ADANITRANS): After absorbing the selling pressure in the range of Rs 350 to Rs 370, this counter is ready to climb higher levels from a medium-term perspective. This breakout may see a gradual rise with profit-booking been considered as the buying and accumulating opportunities. The immediate support stands at Rs 360 and Rs 340 levels with the trend moving in the direction of Rs 430 levels, as per the weekly chart.
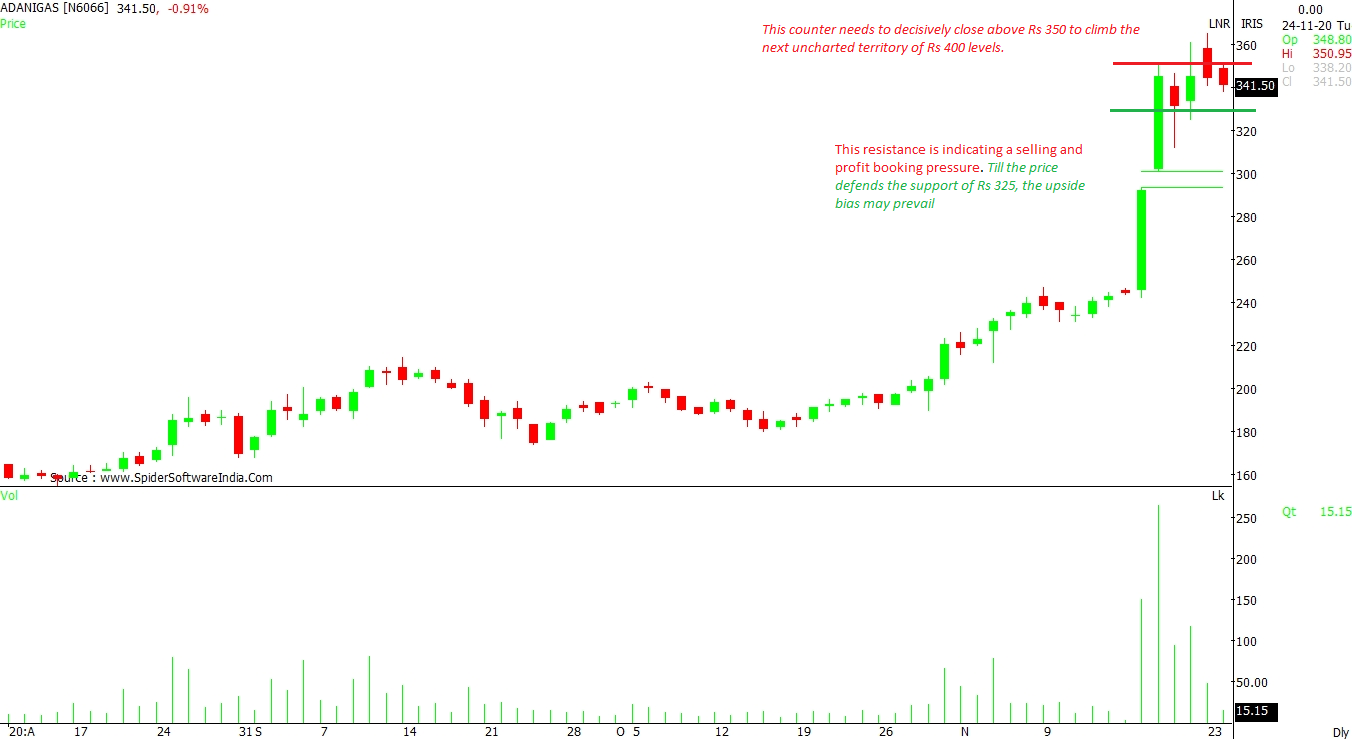
CLICK HERE FOR THE CHART Adani Gas Ltd (ADANIGAS): This counter needs to decisively close above Rs 350 to climb the next uncharted territory of Rs 400 levels. This resistance is indicating a selling and profit booking pressure. Till the price defends the support of Rs 325, the upside bias may prevail, as per the price formation on the daily chart.
CLICK HERE FOR THE CHART  "Adani Green, Adani Ports: Trading strategies for Adani Group stocks")


