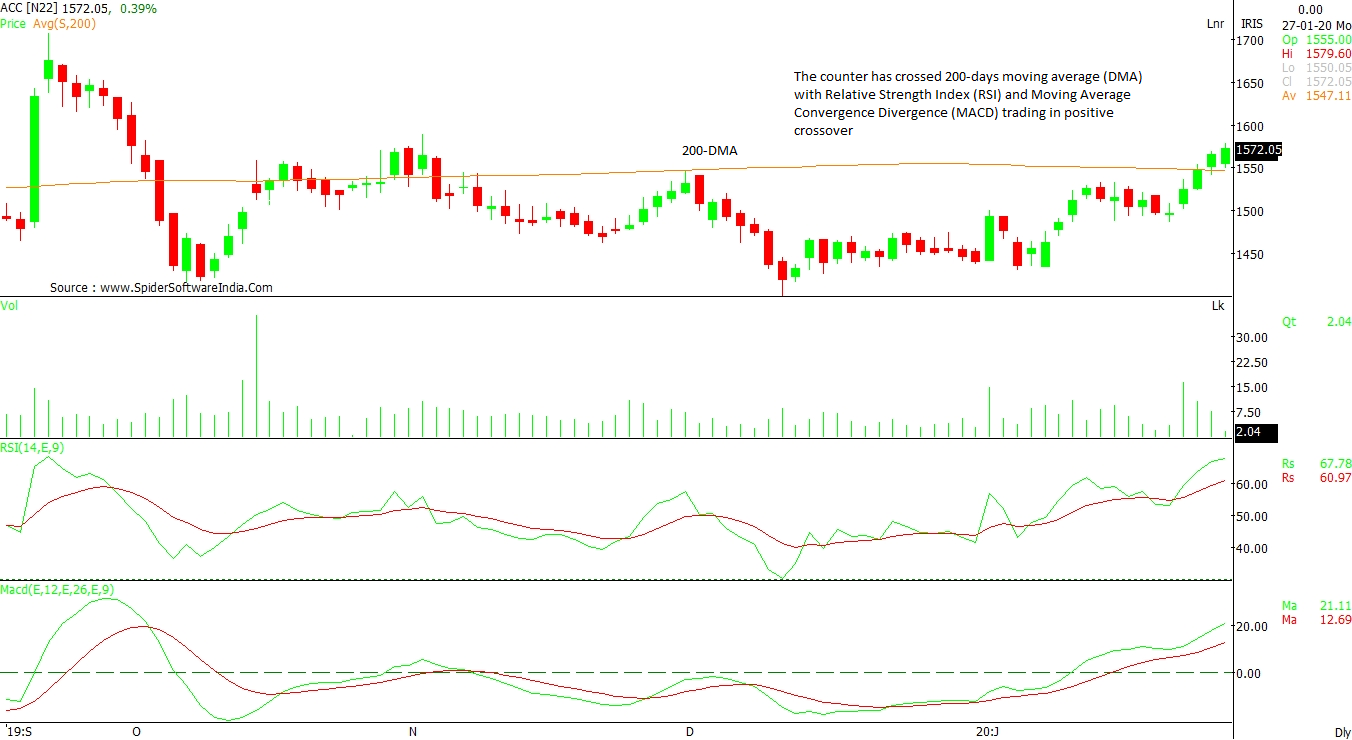
ACC Ltd (ACC): The counter has crossed 200-day moving average (DMA) with Relative Strength Index (RSI) and Moving Average Convergence Divergence (MACD) trading in a positive crossover on the daily chart, a sign of an upward trend. This rally may propel the stock to Rs 1,650 in coming sessions, which is its trend line resistance as per the weekly chart. On the other hand, Rs 1,500 remains a support -- this is accompanied by 50-DMA placed at Rs 1,480 levels.
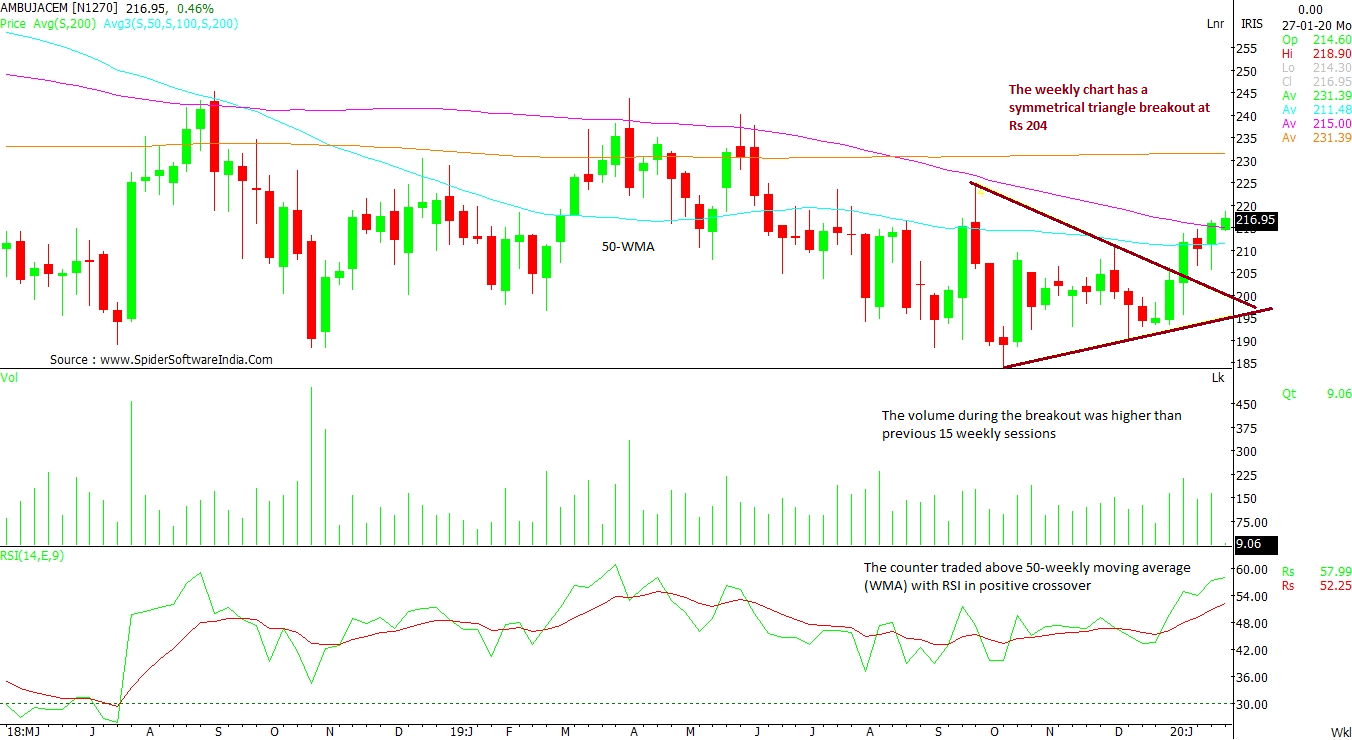
CLICK HERE FOR THE CHART Ambuja Cements Ltd (AMBUJACEM): The stock's weekly chart has a symmetrical triangle breakout at Rs 204 levels. The volume during the breakout was higher than iin the previous 15 weekly sessions. The counter traded above 50-weekly moving average (WMA) with RSI in positive crossover. Now, as the counter has crossed significant resistance of Rs 214-Rs 215, the rally should lead to Rs 220 on primary phase and then to Rs 225, the level where selling pressure was seen last time as per the daily chart.
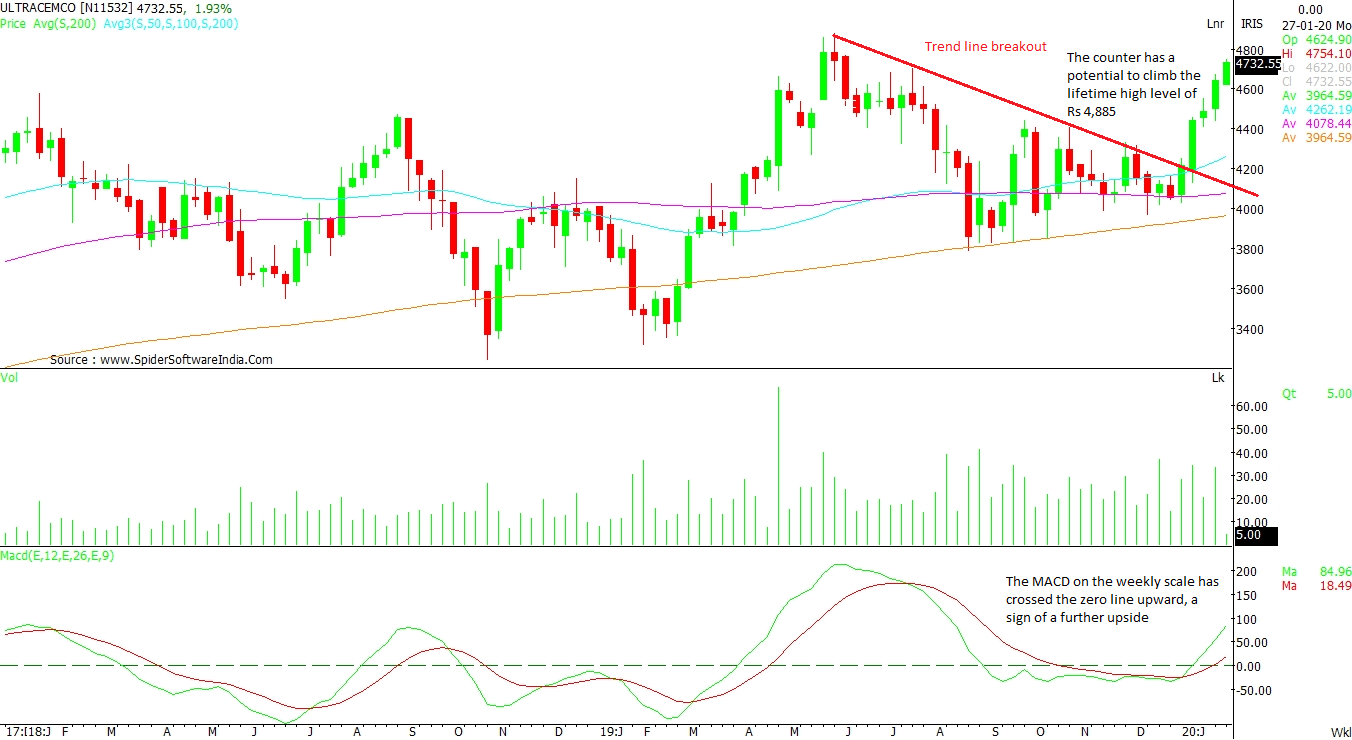
CLICK HERE FOR THE CHART UltraTech Cement Ltd (ULTRACEMCO): A perfect example of a trend line breakout and a support of 200 WMA is pushing this counter to the higher levels, as per the weekly chart. The counter has a potential to scale the lifetime high level of Rs 4,885 as per the monthly chart. The MACD on the weekly scale has crossed the zero line upward, a sign of further upside. Immediate support comes in at Rs 4,400 levels.
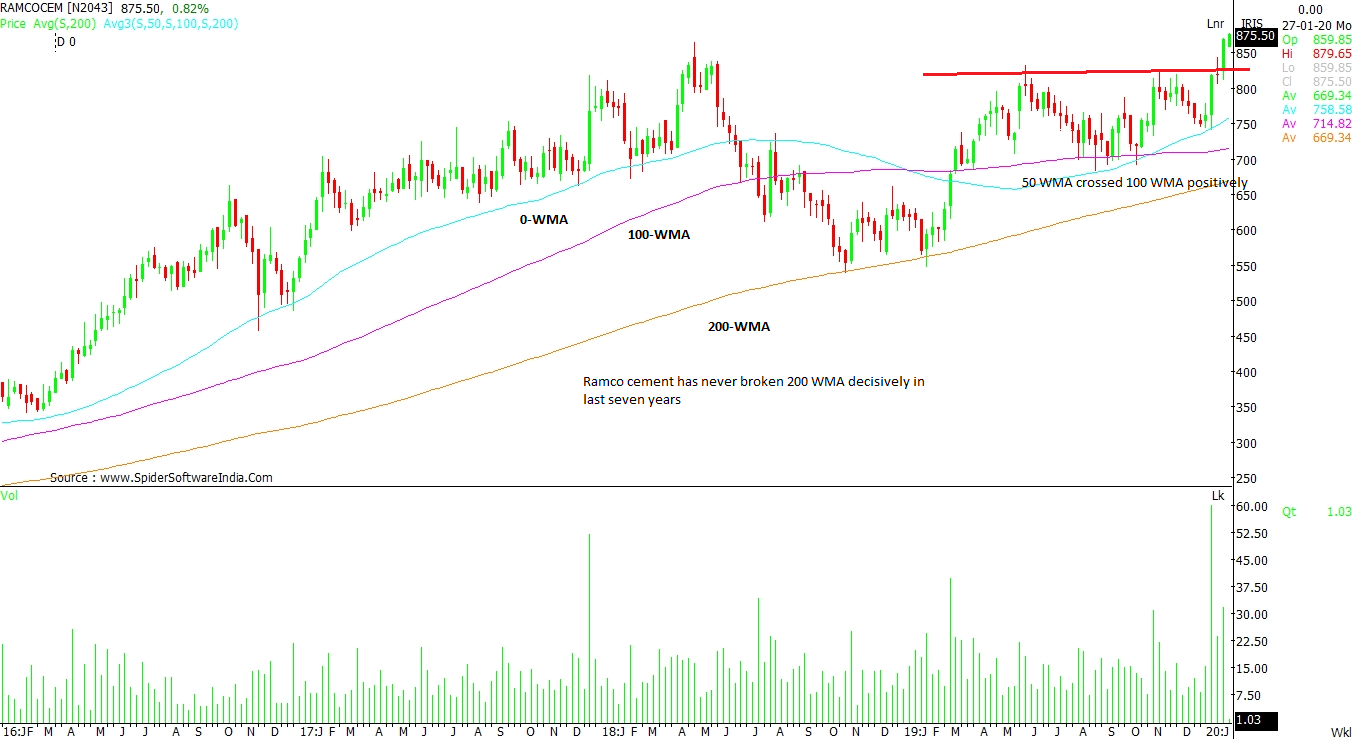
CLICK HERE FOR THE CHART The Ramco Cements Ltd (RAMCOCEM): The counter has climbed a new lifetime high of Rs 879.65. Now that the 50 WMA has crossed 100 WMA positively, this rally may lead to Rs 950 and Rs 980 levels. The immediate support comes at Rs 830 and thereafter at Rs 800 on a closing basis.
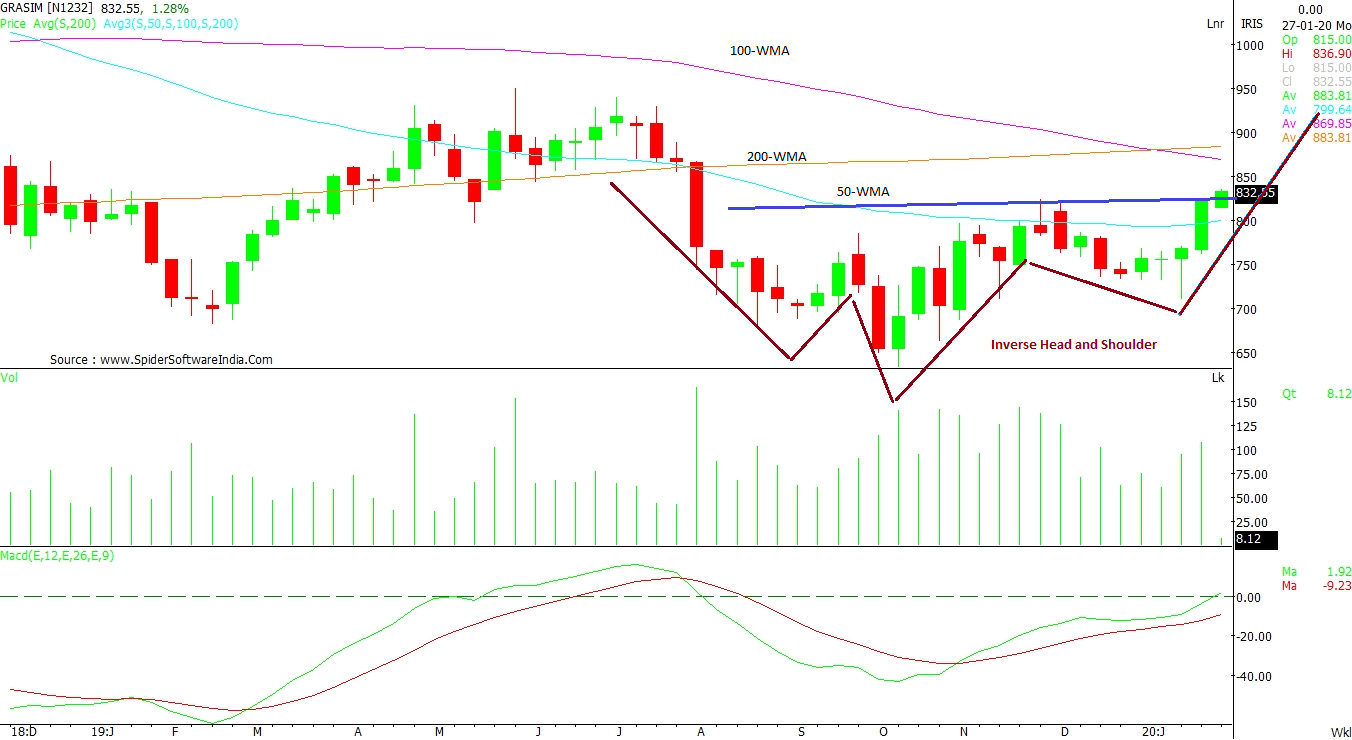
CLICK HERE FOR THE CHART Grasim Industries Ltd (GRASIM): The formation of Inverse Head and Shoulder pattern on the weekly chart has a neckline breakout at Rs 826 which the counter has crossed successfully today. This breakout should initially see Rs 850, followed by Rs 882 -- which is its 200 WMA -- as immediate levels. The support remains at Rs 800 and Rs 770 levels. Moerover, the MACD is attempting to cross zero line upward, a sign of a positive strength.
CLICK HERE FOR THE CHART  "Cement stocks gain up to 24% ahead of Budget 2020. Should you book profit?")


