Private sector lenders Axis Bank and RBL Bank along with engineering conglomerate Larsen & Toubro (L&T) announced their third quarter (October-December) results for the current fiscal year (FY20) on Wednesday.
Let's take a look at how these stocks look on charts and how you should trade them.
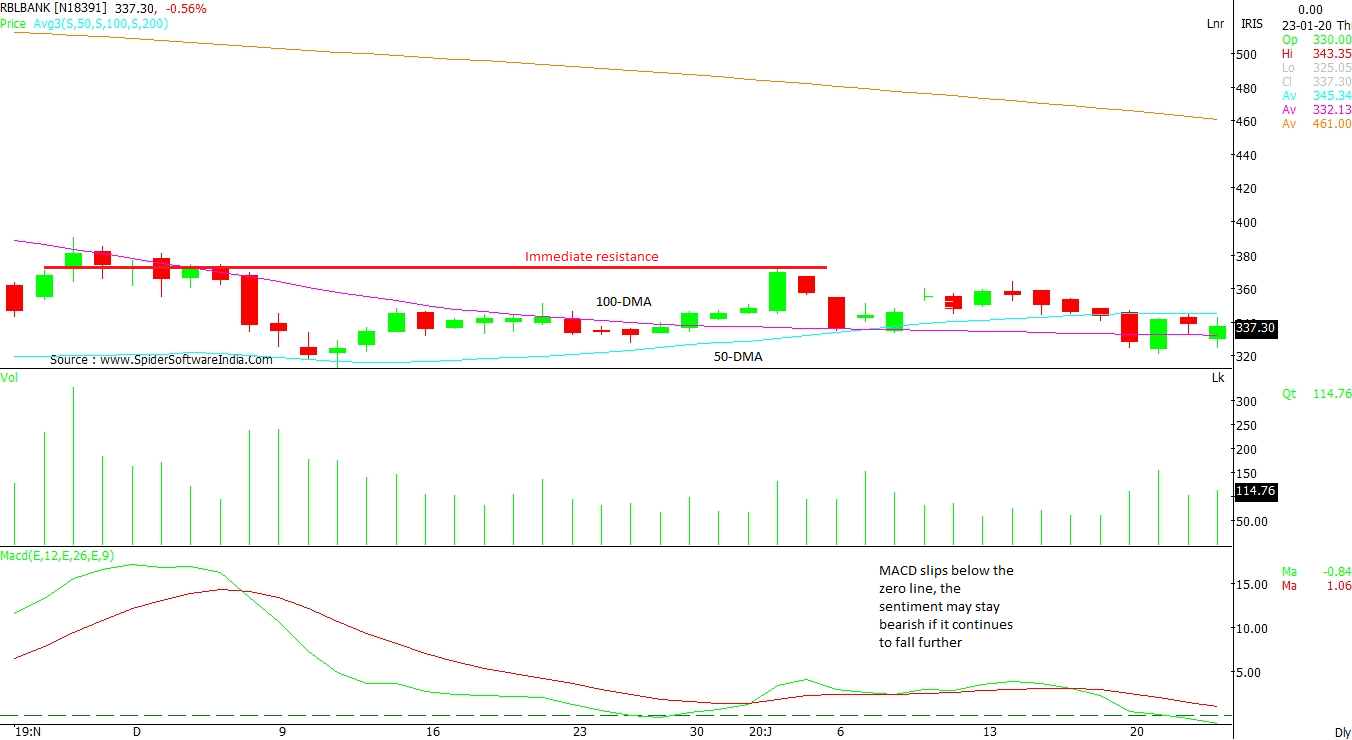
RBL Bank Ltd (RBLBANK): As the Moving Average Convergence Divergence (MACD) has slipped below the zero line, the sentiment may stay bearish if it continues to fall further. Although the current price hovers around the 100-day moving average (DMA) and 200-DMA, it is unable to witness any major upside as MACD fails to hold above the zero line decisively. The breakout level seems to be Rs 373 as per the daily chart. To achieve this, the counter needs to hold ground above Rs 350 with strong volumes. On the other hand, the support remains at Rs 310 levels. CLICK HERE FOR THE CHART
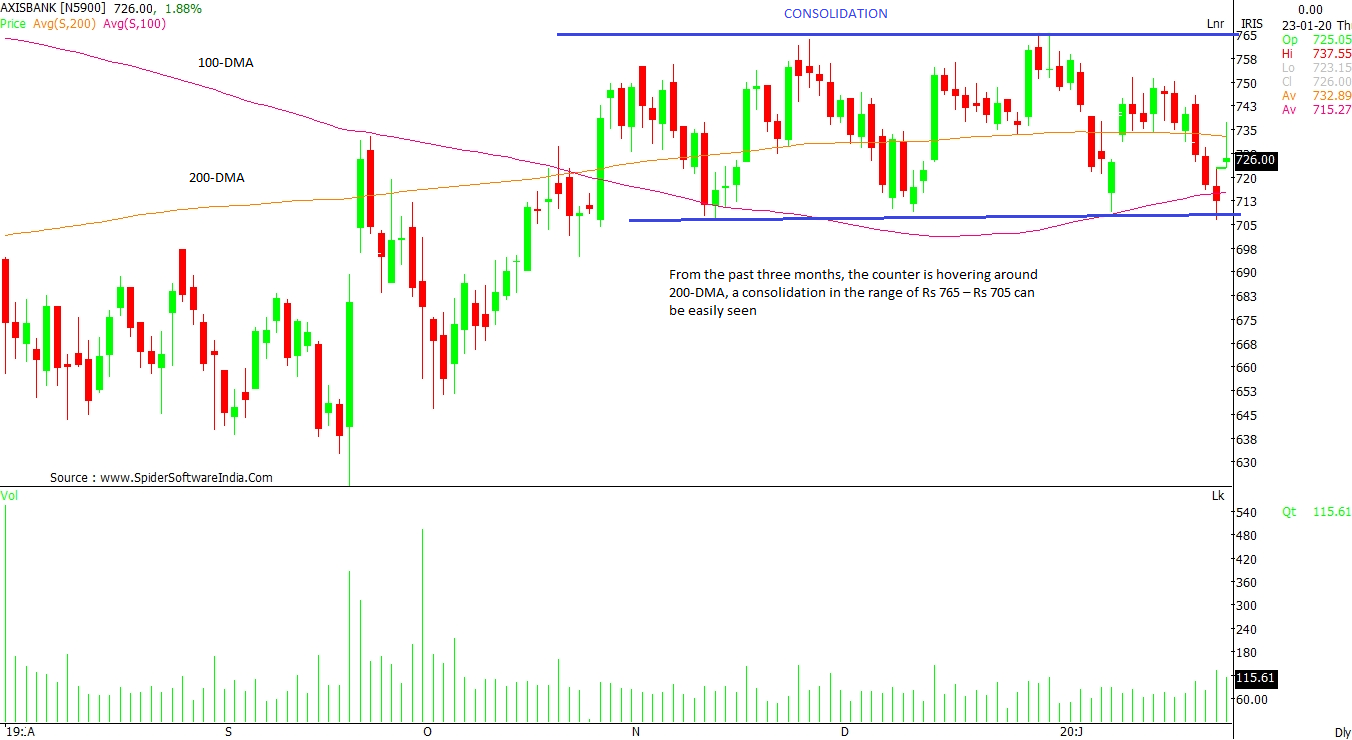
Axis Bank Ltd (AXISBANK): For the past three months, the counter has hovered around 200-DMA. A consolidation can be easily seen in the range of Rs 765 – Rs 705. On the downside, Rs 515.30 acts as a support, which is also its 100-DMA at present. This consolidation may see breakdown if the counter closes below 100-DMA for two consecutive days. However, on the higher side, if it manages to close above Rs 765, then the rally may see Rs 820 and Rs 845 levels. CLICK HERE FOR THE CHART
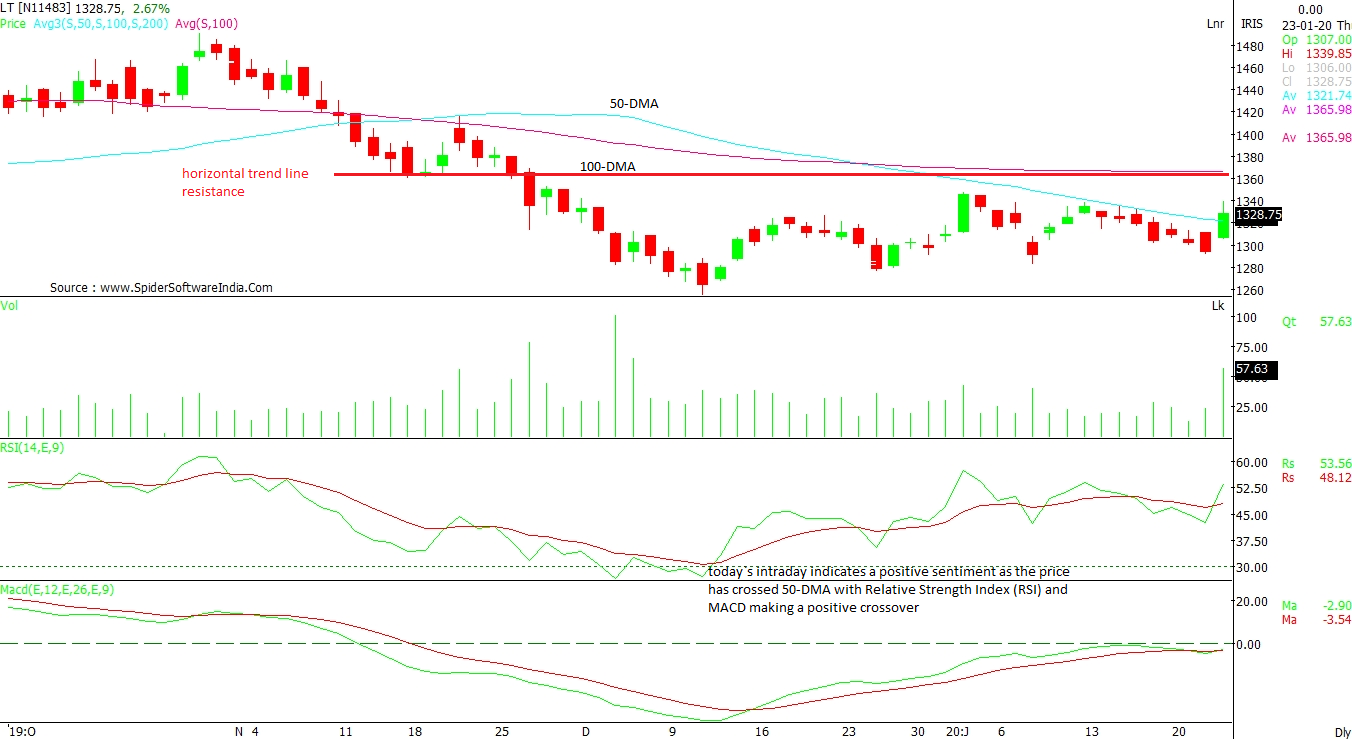
Larsen & Toubro Ltd (LT): If this counter scale above Rs 1,365, which is a horizontal trend line resistance and coincidentally a 100-DMA level, then it should move towards Rs 1,410 and Rs 1,445 levels, as per the daily chart. Today's intraday high indicates a positive sentiment as the price has crossed 50-DMA with Relative Strength Index (RSI) and MACD making a positive crossover. The support remains at Rs 1,275 levels. CLICK HERE FOR THE CHART
Read this article for free
Register to continue reading premium journalism and analysis from Business Standard.
 "L&T, Axis Bank, RBL Bank: How to trade these stocks post Q3 results?")


