Shares of cement companies were trading in the positive zone in early trades on Thursday, even as the benchmark indices (Sensex and the Nifty) opened with cuts of over half a per cent each.
During the recent rebound, cement shares were seen as laggards compared to other sectors. The BSE Sensex and Nifty 50 reversed and gained almost 10 per cent from their respective lows, whereas cement stocks soared in the range of 10-15 per cent. The rise in prices was at a slower pace with no significant buying interest.
However, going ahead, charts indicate likely revival in investor sentiment with further uptick in prices.
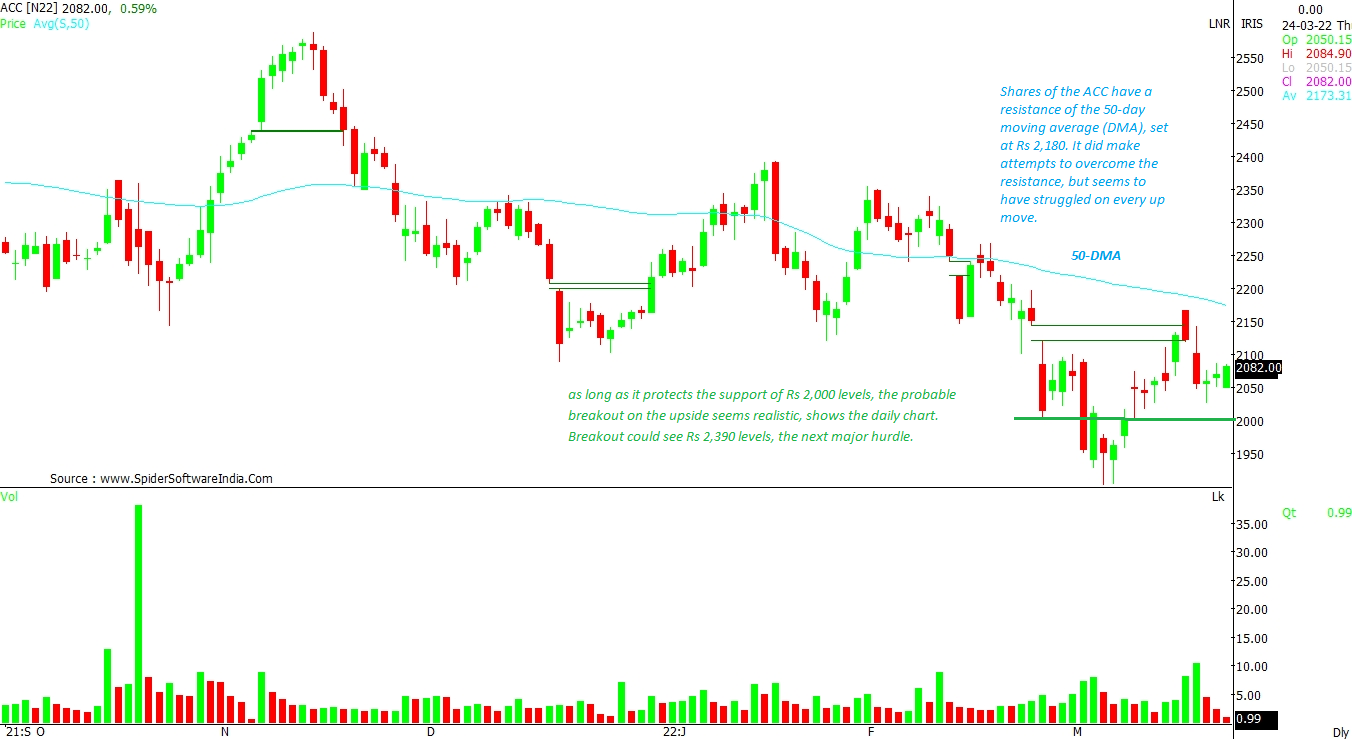
ACC Ltd (ACC)
Likely target: Rs 2,390 (breakout above 50-DMA)
Upside potential: 10%
Shares of the ACC seems to be facing resistance at the 50-day moving average (DMA), set at Rs 2,180. The stock did make multiple attempts to overcome the resistance, but seems to struggled on every occasion. That’s said, as long as it protects the support at Rs 2,000-mark, the likelihood of a breakout on the upside seems realistic, hints the daily chart. On a breakout, the stock could rally towards Rs 2,390 level, the next major hurdle. CLICK HERE FOR THE CHART
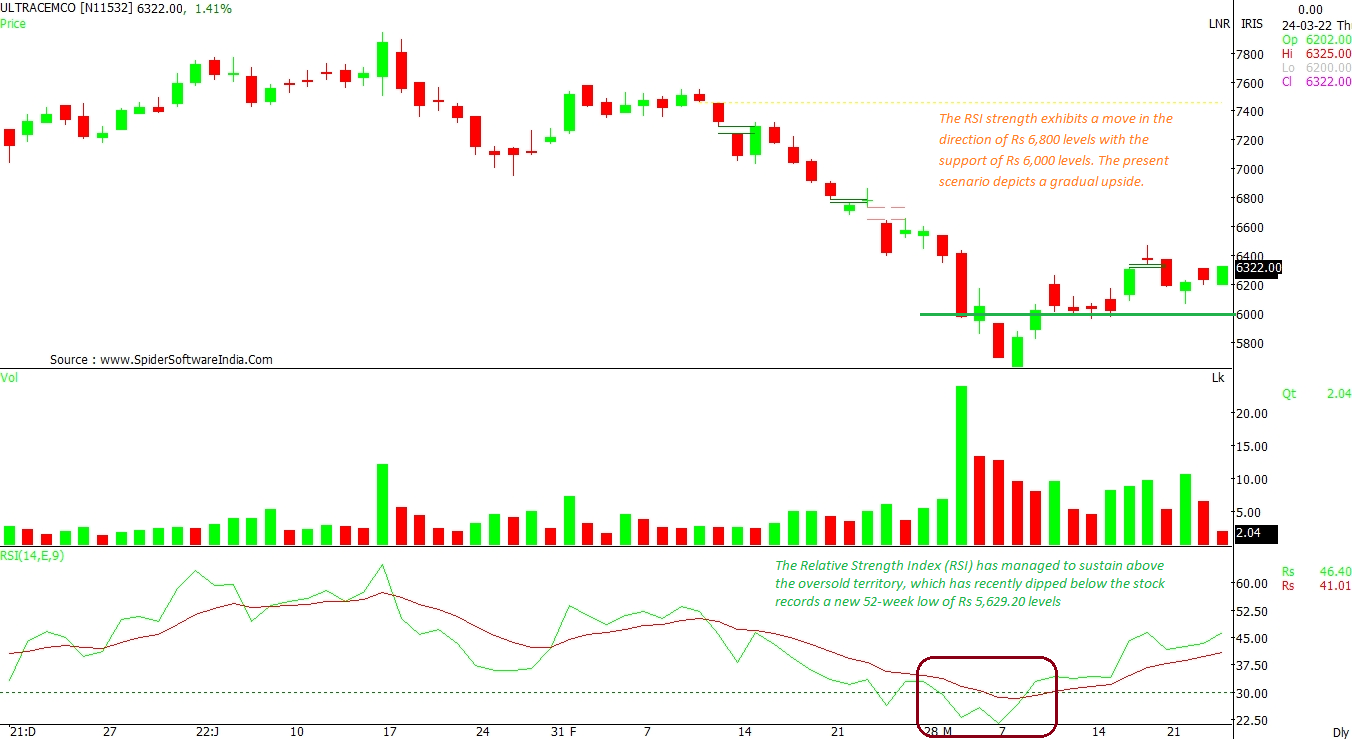
UltraTech Cement Ltd (ULTRACEMCO)
Likely target: Rs 6,800
Upside potential: 8%
The Relative Strength Index (RSI) of the stock has managed to sustain above the oversold territory, even as the stock dipped to register a new 52-week low of Rs 5,629.20 level, shows the daily chart. This strength exhibits a move in the direction of Rs 6,800 level with the support at Rs 6,000-mark. The present scenario depicts a gradual upside for the stock going ahead. CLICK HERE FOR THE CHART
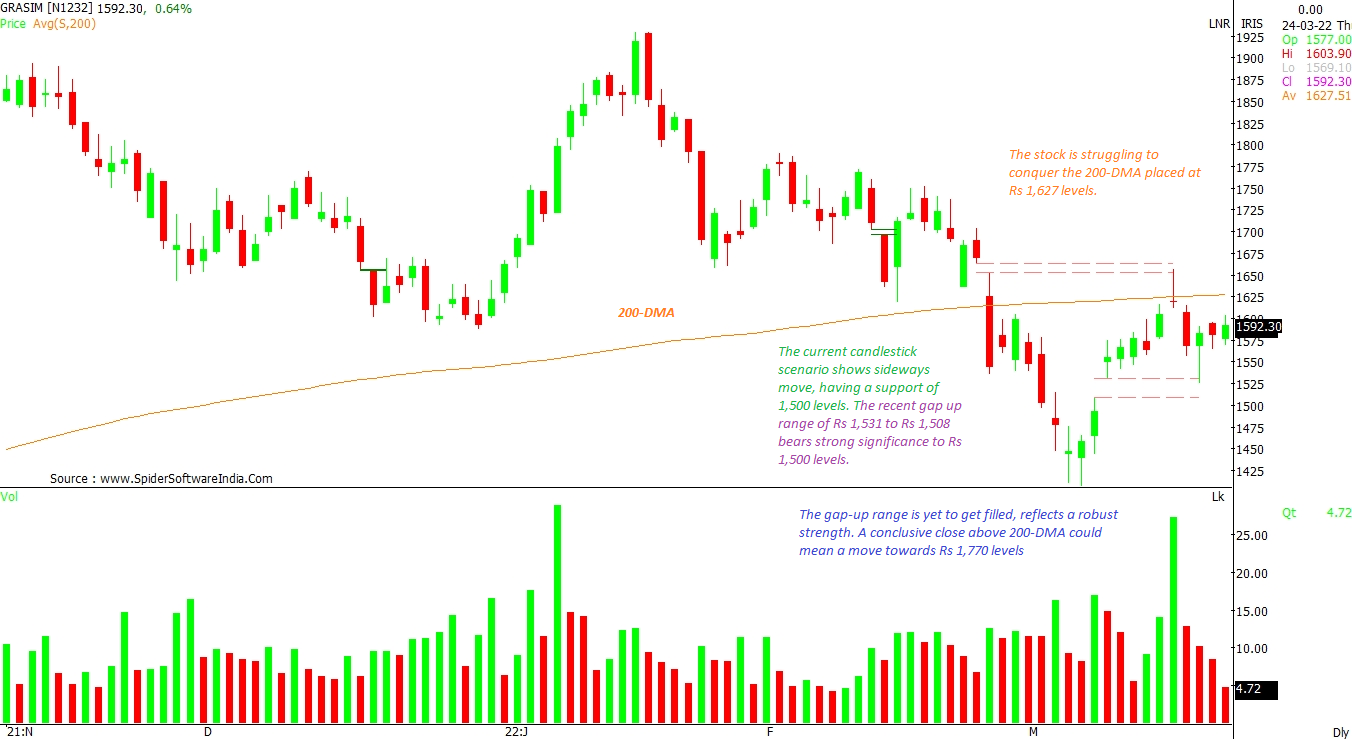
Grasim Industries Ltd (GRASIM)
Likely target: Rs 1,770 (after crossing 200-DMA)
Upside potential: 9%
The stock seems to be struggling to conquer the 200-DMA placed at Rs 1,627. The current candlestick scenario shows sideways movement, having a support at Rs 1,500 level. The recent gap-up range of Rs 1,531 to Rs 1,508 bears strong significance with support now seen at Rs 1,500 level. The gap-up range is yet to get filled, which reflects a robust strength at the counter. A conclusive close above the 200-DMA could hint of a move towards Rs 1,770 level, as per the daily chart. CLICK HERE FOR THE CHART
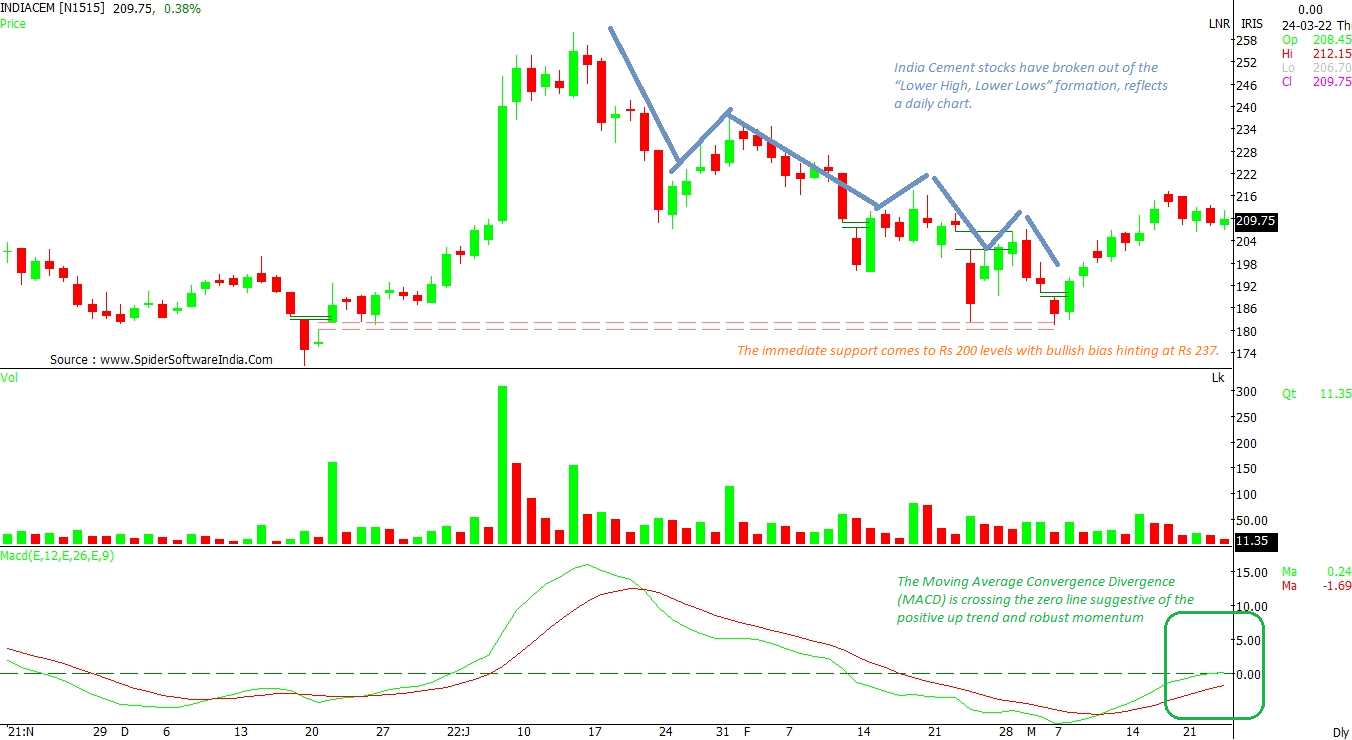
India Cements Ltd (INDIACEM)
Likely target: Rs 237
Upside potential: 12%
Shares of India Cement have broken out of the “Lower High, Lower Lows” formation, reflects daily chart. The Moving Average Convergence Divergence (MACD) is crossing the zero line suggestive of the positive up trend and robust momentum. The immediate support for the stock comes at Rs 200 with bullish bias hinting towards Rs 237. CLICK HERE FOR THE CHART
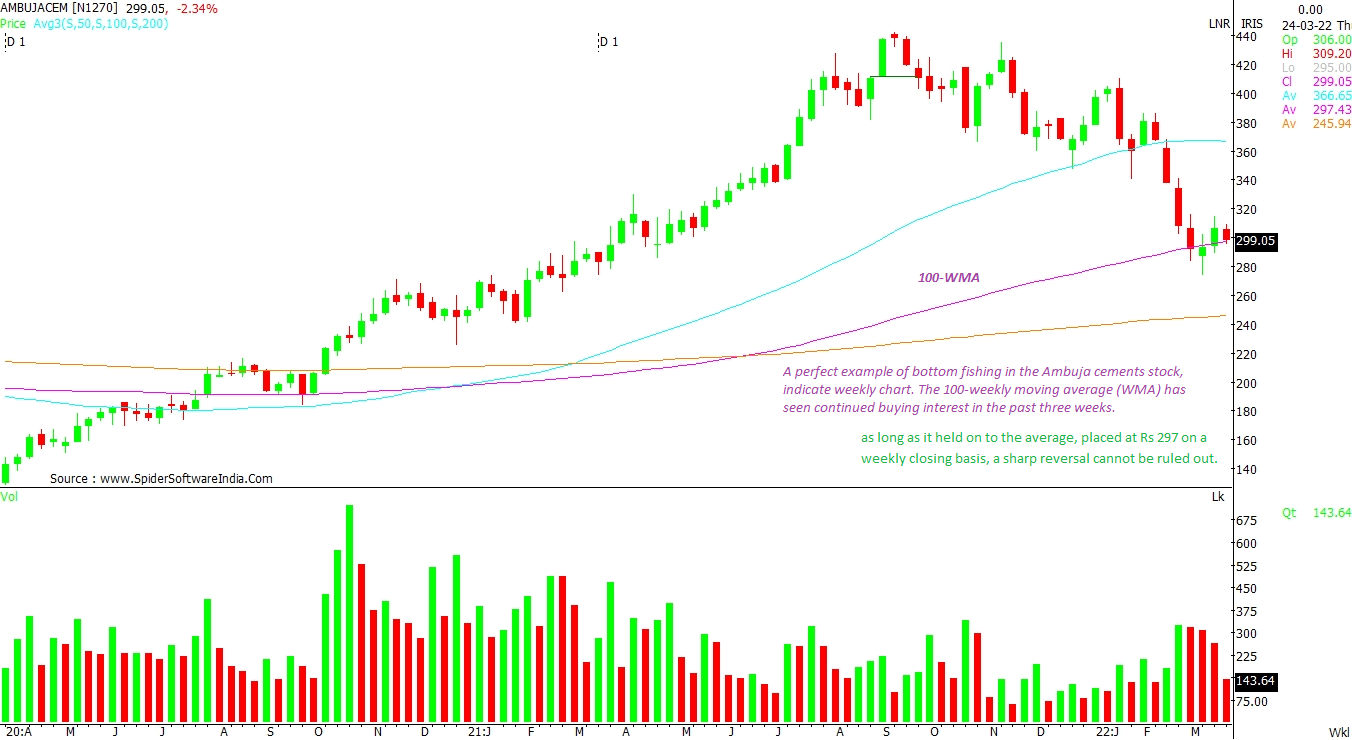
Ambuja Cements (AMBUJACEM)
Outlook: chart shows bottom fishing
The weekly chart of Ambuja Cements exhibits a perfect example of bottom fishing. The 100-weekly moving average (WMA) has seen continued buying interest in the past three weeks. Thus, as long as it held on, placed at Rs 297, on a weekly closing basis, a sharp reversal cannot be ruled out. CLICK HERE FOR THE CHART
Read this article for free
Register to continue reading premium journalism and analysis from Business Standard.
 "ACC, Grasim, India Cements can gain up to 12% post breakout, hint charts")


